US cities › California › Santa Ana
Santa Ana noise map: where the city is loudest
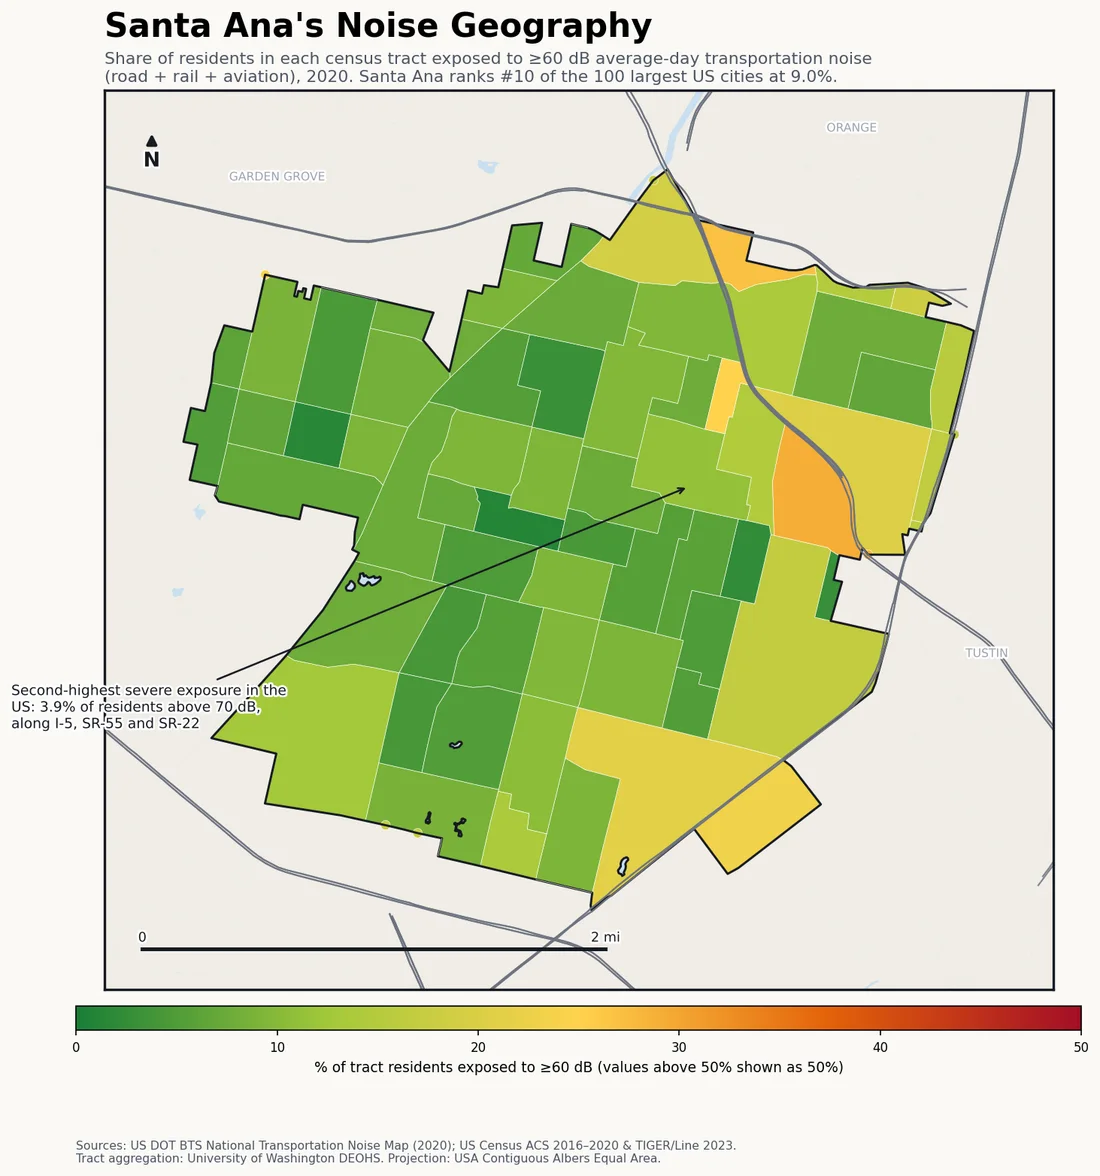
Santa Ana ranks 23rd in the US: 9% of residents live above 60 dB and 3.9% above 70 dB — one of the highest severe shares in the country. Three freeways cross one of the densest cities in California, and John Wayne Airport sits on its southern border.
Last updated:
Find your street on the interactive map → Pan and zoom to your own block, type any US address, or use your location.
| US rank (of 297 cities, 100k+ pop) | #23 |
|---|---|
| Residents above 60 dB | 9% |
| Residents above 70 dB | 3.9% |
| Residents in the 45–60 dB band | 35.8% |
| Population (ACS 2016–2020) | 325,359 |
| Census tracts mapped | 52 |
Santa Ana packs one of California’s densest populations into a flat grid crossed by I-5, SR-55 and SR-22, and its severe-exposure share (3.9% of residents above 70 dB) ranks among the highest in the state, close behind neighboring Anaheim. The two cities are effectively one freeway-noise system — Orange County’s urban core, laced with corridors built before anyone priced in the people beside them.
On the southern boundary sits John Wayne Airport — officially located in Santa Ana — which is itself a landmark in noise politics: its strict nighttime curfew and famously steep “quiet” departure climbs exist because of decades of litigation from communities under the flight paths. The airport’s noise rules are among the most restrictive in the country, which is partly why the city’s red concentrates along the freeways instead.
Santa Ana noise: the specifics
- Among the highest severe-exposure shares in the US: 3.9% of residents above 70 dB.
- John Wayne Airport (officially in Santa Ana) operates one of the strictest airport noise curfews in the country, with steep noise-abatement departures.
- Among the densest cities in California, with housing tight against the I-5, SR-55 and SR-22 corridors.
- 9% of residents above 60 dB ranks #23 of 297 US cities — see the full measured ranking.
What share of Santa Ana residents are exposed to 60 dB or louder transportation noise?
9% of Santa Ana residents live with average-day transportation noise (road, rail and aviation) at or above 60 dB, and 3.9% are above 70 dB — ranking Santa Ana #23 of 297 US cities by noise exposure.
How Santa Ana ranks
- #17 of 66 California cities in-state
- Louder: Hayward, CA #22
- Quieter: Newark, NJ #24
Cities near Santa Ana
The nearest ranked cities to Santa Ana, each with its own share of residents above 60 dB for a like-for-like comparison.
- Orange, CA 10.3% ≥60 dB
- Garden Grove, CA 8.2% ≥60 dB
- Costa Mesa, CA 7.8% ≥60 dB
- Irvine, CA 7.9% ≥60 dB
How this map is made
This is a transparent aggregation of federal data, not an estimate: the BTS 2020 National Transportation Noise Map (road + rail + aviation) overlaid with Census ACS 2016–2020 population at tract level, clipped to the city boundary. Full methodology, limitations and the free CSV/JSON are on the US cities noise ranking. Remember what it doesn’t count: sirens, construction, nightlife and neighbors are outside the model.
License: this Santa Ana noise map and its underlying numbers are published under CC BY 4.0 — reuse or republish the map or the figures anywhere with attribution to decibelshield.app (source: BTS 2020 National Transportation Noise Map × Census ACS; basemap © OpenStreetMap contributors, © CARTO). Download the full dataset (CSV · JSON) or the full-resolution Santa Ana map image.
How loud is your block?
The map above shows averages by tract — your street is its own story. Measure it with the free online decibel meter → No install, nothing recorded.
Want to see the modeled road, rail and aircraft noise street by street? Open the interactive noise map zoomed to Santa Ana → Pan and zoom to your own neighborhood, type your address to check a specific spot, or use your location.
← All California cities · All 297 US cities ranked · World city sound map