The loudest cities in the US, ranked by noise exposure
Inglewood, California is the loudest US city by transportation-noise exposure: 26.3% of residents live with 60 dB or louder average-day noise, because it sits directly under LAX's flight paths. Elizabeth NJ and Santa Clara CA follow; Boston is the loudest truly large city, and New York ranks only 47th.
Last updated:
🔎 Want street-level detail? The interactive noise map lets you zoom to any block in the country and see the modeled road, rail and aircraft noise where you live, tap to jump to your own location, or type any US street address to read the modeled level there. New York , Los Angeles and Chicago have their own noise page for every neighborhood. See the loudest neighborhoods in America.
The ranking: all 297 US cities with 100,000+ residents
Share of each city's residents exposed to ≥60 dB and ≥70 dB average-day transportation noise (road + rail + aviation), population-weighted from census-tract data. 60 dB is constant-conversation loudness — well above the WHO's 53 dB Lden road-noise guideline; 70 dB is the level US agencies treat as a serious annoyance threshold.
| # | City | State | ≥60 dB | ≥70 dB | 45–60 dB | Population |
|---|---|---|---|---|---|---|
| 1 | Inglewood | CA | 26.3% | 2.9% | 63.9% | 110,017 |
| 2 | Elizabeth | NJ | 13.8% | 1.7% | 86.1% | 124,099 |
| 3 | Santa Clara | CA | 13.5% | 3.1% | 56.2% | 124,478 |
| 4 | Boston | MA | 12.9% | 2.6% | 73.4% | 682,902 |
| 5 | Fresno | CA | 12.1% | 2.2% | 66.6% | 488,327 |
| 6 | East Los Angeles | CA | 11.2% | 4.3% | 58.2% | 117,839 |
| 7 | Burbank | CA | 11.2% | 3.3% | 56.9% | 108,500 |
| 8 | Richmond | CA | 11.1% | 3.1% | 66.1% | 106,368 |
| 9 | Chicago | IL | 11% | 1.7% | 83.4% | 2,698,334 |
| 10 | Anaheim | CA | 10.7% | 4.2% | 31.5% | 333,887 |
| 11 | Orange | CA | 10.3% | 4.4% | 32.4% | 118,910 |
| 12 | Norwalk | CA | 10.1% | 4.3% | 28.3% | 106,313 |
| 13 | Oakland | CA | 10% | 3.6% | 53.1% | 422,575 |
| 14 | Honolulu | HI | 9.9% | 2.1% | 30.2% | 348,116 |
| 15 | Los Angeles | CA | 9.8% | 3.7% | 42.6% | 3,959,866 |
| 16 | Compton | CA | 9.7% | 2.9% | 33% | 103,665 |
| 17 | North Charleston | SC | 9.6% | 1.9% | 61.3% | 118,971 |
| 18 | San Francisco | CA | 9.5% | 2.7% | 34.9% | 874,784 |
| 19 | Tempe | AZ | 9.3% | 1.9% | 43.6% | 190,513 |
| 20 | Stockton | CA | 9.2% | 2.3% | 49.8% | 289,925 |
| 21 | Ontario | CA | 9.1% | 4% | 80.9% | 178,194 |
| 22 | Hayward | CA | 9% | 3% | 77.9% | 147,349 |
| 23 | Santa Ana | CA | 9% | 3.9% | 35.8% | 325,359 |
| 24 | Newark | NJ | 8.9% | 1.5% | 81.9% | 281,917 |
| 25 | Sunnyvale | CA | 8.9% | 4% | 44.2% | 159,216 |
| 26 | Laredo | TX | 8.9% | 0.9% | 70.1% | 241,239 |
| 27 | Pomona | CA | 8.9% | 3.2% | 61.7% | 151,424 |
| 28 | Sacramento | CA | 8.9% | 2.7% | 62.9% | 492,077 |
| 29 | San Jose | CA | 8.8% | 3.3% | 41% | 984,403 |
| 30 | Long Beach | CA | 8.5% | 3.7% | 67.2% | 463,504 |
| 31 | Fullerton | CA | 8.5% | 3.4% | 47.5% | 155,640 |
| 32 | Glendale | CA | 8.3% | 3% | 48.5% | 199,357 |
| 33 | San Diego | CA | 8.3% | 3.1% | 43.6% | 1,414,853 |
| 34 | Garden Grove | CA | 8.2% | 3.8% | 20.1% | 184,722 |
| 35 | Paradise | NV | 8.1% | 1.4% | 59.9% | 195,562 |
| 36 | Atlanta | GA | 7.9% | 2.2% | 48.3% | 490,846 |
| 37 | Irvine | CA | 7.9% | 3.4% | 29.7% | 269,716 |
| 38 | Costa Mesa | CA | 7.8% | 3.2% | 55.2% | 115,397 |
| 39 | Mission Viejo | CA | 7.7% | 2.6% | 21% | 100,214 |
| 40 | Cambridge | MA | 7.7% | 0.3% | 63.9% | 117,822 |
| 41 | West Palm Beach | FL | 7.6% | 1.8% | 49.1% | 105,582 |
| 42 | Pompano Beach | FL | 7.6% | 2.2% | 84.6% | 109,495 |
| 43 | Pasadena | CA | 7.6% | 3% | 31.4% | 142,063 |
| 44 | Torrance | CA | 7.6% | 3.5% | 20.8% | 144,430 |
| 45 | Miami | FL | 7.5% | 1.5% | 79.9% | 461,675 |
| 46 | Concord | CA | 7.4% | 2.9% | 40.2% | 137,473 |
| 47 | New York | NY | 7.4% | 1.7% | 65.4% | 8,347,434 |
| 48 | Portland | OR | 7.2% | 1.4% | 40.1% | 650,191 |
| 49 | Downey | CA | 7.2% | 3.8% | 39.2% | 109,815 |
| 50 | Fremont | CA | 7.1% | 2.6% | 38.9% | 234,829 |
| 51 | Dallas | TX | 7% | 1.6% | 38.3% | 1,382,096 |
| 52 | Provo | UT | 7% | 1.3% | 34.1% | 102,249 |
| 53 | Yonkers | NY | 6.9% | 2.5% | 50.2% | 200,183 |
| 54 | Hialeah | FL | 6.9% | 1.9% | 41.9% | 230,853 |
| 55 | Berkeley | CA | 6.8% | 1.7% | 44.1% | 123,065 |
| 56 | Madison | WI | 6.8% | 1.6% | 40.3% | 254,212 |
| 57 | Vallejo | CA | 6.7% | 2.1% | 18.2% | 115,463 |
| 58 | Cleveland | OH | 6.7% | 1.7% | 63.9% | 383,665 |
| 59 | Louisville | KY | 6.6% | 1.3% | 39% | 628,044 |
| 60 | Lowell | MA | 6.6% | 1% | 29.5% | 111,311 |
| 61 | Minneapolis | MN | 6.6% | 2% | 70.5% | 424,536 |
| 62 | Irving | TX | 6.5% | 1.5% | 62.7% | 240,475 |
| 63 | Phoenix | AZ | 6.5% | 1.1% | 28.7% | 1,648,739 |
| 64 | Davie | FL | 6.4% | 2.4% | 47.5% | 105,075 |
| 65 | Mesa | AZ | 6.4% | 1.1% | 42.2% | 497,973 |
| 66 | Alexandria | VA | 6.3% | 1.4% | 60.6% | 158,309 |
| 67 | Wilmington | NC | 6.3% | 0.5% | 30.5% | 120,932 |
| 68 | Fort Lauderdale | FL | 6.2% | 1.6% | 47.5% | 176,299 |
| 69 | Lexington-Fayette | KY | 6.2% | 1.2% | 27.5% | 322,200 |
| 70 | El Monte | CA | 6.2% | 2.4% | 25.8% | 113,817 |
| 71 | Philadelphia | PA | 6.1% | 1.1% | 66.2% | 1,581,531 |
| 72 | Birmingham | AL | 6.1% | 1.4% | 51.4% | 204,188 |
| 73 | Oxnard | CA | 6.1% | 1.3% | 53.5% | 188,232 |
| 74 | Chandler | AZ | 6.1% | 1% | 37.8% | 253,979 |
| 75 | Arlington | VA | 6.1% | 1.5% | 46.2% | 236,434 |
| 76 | Thousand Oaks | CA | 6.1% | 2% | 13.5% | 127,782 |
| 77 | Worcester | MA | 6.1% | 1.5% | 29% | 185,186 |
| 78 | San Bernardino | CA | 6% | 2.7% | 44.3% | 216,673 |
| 79 | Miramar | FL | 6% | 1.9% | 14% | 140,713 |
| 80 | Stamford | CT | 5.9% | 1.6% | 41.7% | 130,057 |
| 81 | Gresham | OR | 5.9% | 0.5% | 44.7% | 113,648 |
| 82 | Escondido | CA | 5.8% | 2.1% | 18.9% | 127,074 |
| 83 | Pittsburgh | PA | 5.8% | 1.8% | 61.5% | 301,286 |
| 84 | Huntington Beach | CA | 5.8% | 2.7% | 21.9% | 195,835 |
| 85 | Seattle | WA | 5.8% | 1.2% | 51.6% | 741,171 |
| 86 | Washington | DC | 5.8% | 0.8% | 48.6% | 701,974 |
| 87 | Midland | TX | 5.8% | 1.2% | 42.8% | 134,345 |
| 88 | Salt Lake City | UT | 5.7% | 1.3% | 48.2% | 207,852 |
| 89 | Fort Worth | TX | 5.7% | 1.3% | 49.6% | 842,371 |
| 90 | Lewisville | TX | 5.7% | 1.5% | 74.5% | 126,827 |
| 91 | Riverside | CA | 5.7% | 1.7% | 34.2% | 317,360 |
| 92 | Houston | TX | 5.7% | 1.7% | 40.2% | 2,326,953 |
| 93 | Modesto | CA | 5.7% | 1.7% | 37.6% | 188,833 |
| 94 | Reno | NV | 5.6% | 1.5% | 38.8% | 236,730 |
| 95 | Miami Gardens | FL | 5.6% | 1.7% | 48% | 107,344 |
| 96 | Salem | OR | 5.5% | 0.8% | 37.5% | 140,444 |
| 97 | Lubbock | TX | 5.5% | 0.9% | 17.3% | 260,189 |
| 98 | Tucson | AZ | 5.5% | 0.4% | 30.8% | 525,777 |
| 99 | Glendale | AZ | 5.5% | 0.6% | 18.5% | 252,246 |
| 100 | Odessa | TX | 5.4% | 1.1% | 38.7% | 112,598 |
| 101 | Springfield | MA | 5.4% | 1.1% | 41% | 153,677 |
| 102 | Scottsdale | AZ | 5.3% | 0.7% | 27.8% | 241,030 |
| 103 | Memphis | TN | 5.3% | 0.8% | 43% | 646,100 |
| 104 | Jersey City | NJ | 5.3% | 1.2% | 70.9% | 250,269 |
| 105 | Everett | WA | 5.2% | 1.2% | 42.6% | 109,923 |
| 106 | Carlsbad | CA | 5.2% | 1.9% | 46.7% | 118,198 |
| 107 | El Paso | TX | 5.2% | 1.1% | 34.3% | 652,492 |
| 108 | Milwaukee | WI | 5.2% | 1.3% | 36% | 592,951 |
| 109 | Rancho Cucamonga | CA | 5.2% | 2.5% | 18.2% | 178,060 |
| 110 | Orlando | FL | 5.2% | 1.5% | 52.5% | 284,419 |
| 111 | Vancouver | WA | 5.2% | 1.3% | 40.2% | 175,285 |
| 112 | Amarillo | TX | 5.1% | 1.4% | 47.9% | 198,530 |
| 113 | Joliet | IL | 5.1% | 0.8% | 40.2% | 149,722 |
| 114 | New Haven | CT | 5.1% | 1.2% | 41.3% | 130,381 |
| 115 | Nashville | TN | 5.1% | 1.2% | 40.4% | 661,890 |
| 116 | Elk Grove | CA | 5.1% | 1.4% | 26.3% | 159,273 |
| 117 | Salinas | CA | 5.1% | 1.6% | 47.9% | 134,204 |
| 118 | Beaumont | TX | 5.1% | 1.1% | 41.8% | 116,834 |
| 119 | Sandy Springs | GA | 5.1% | 1.6% | 16.3% | 108,606 |
| 120 | Indianapolis | IN | 5.1% | 1.2% | 30.3% | 861,435 |
| 121 | Knoxville | TN | 5% | 1.3% | 20% | 183,769 |
| 122 | Paterson | NJ | 5% | 1.3% | 60.2% | 145,484 |
| 123 | Detroit | MI | 5% | 1.1% | 24.1% | 672,892 |
| 124 | Newport News | VA | 4.9% | 1.1% | 30.6% | 179,582 |
| 125 | Grand Prairie | TX | 4.9% | 1.3% | 42.6% | 196,874 |
| 126 | Jacksonville | FL | 4.9% | 1.1% | 65.3% | 903,707 |
| 127 | Carrollton | TX | 4.9% | 1.4% | 42.1% | 135,153 |
| 128 | Pasadena | TX | 4.8% | 0.8% | 51.7% | 155,928 |
| 129 | Sioux Falls | SD | 4.8% | 0.9% | 47.3% | 168,927 |
| 130 | Lansing | MI | 4.8% | 0.7% | 20.7% | 120,339 |
| 131 | Gilbert | AZ | 4.8% | 0.4% | 25% | 238,079 |
| 132 | Austin | TX | 4.8% | 1.5% | 22.7% | 968,088 |
| 133 | Santa Rosa | CA | 4.8% | 1.5% | 23.5% | 143,050 |
| 134 | Kent | WA | 4.8% | 1% | 35.4% | 115,108 |
| 135 | Warren | MI | 4.7% | 1% | 18% | 134,188 |
| 136 | Manchester | NH | 4.7% | 1% | 34.9% | 112,441 |
| 137 | Roseville | CA | 4.7% | 1.3% | 27.8% | 121,304 |
| 138 | Hollywood | FL | 4.7% | 1% | 27.8% | 147,929 |
| 139 | Cedar Rapids | IA | 4.7% | 1.3% | 24.9% | 105,438 |
| 140 | Corona | CA | 4.7% | 1.6% | 32.1% | 154,657 |
| 141 | Independence | MO | 4.7% | 1% | 36.9% | 116,669 |
| 142 | Ann Arbor | MI | 4.7% | 0.8% | 21.9% | 121,979 |
| 143 | Bakersfield | CA | 4.7% | 1.4% | 23% | 363,313 |
| 144 | Richmond | VA | 4.6% | 1.4% | 45.4% | 229,233 |
| 145 | College Station | TX | 4.6% | 1% | 29.4% | 104,608 |
| 146 | Mesquite | TX | 4.6% | 1.7% | 28.5% | 147,919 |
| 147 | Albuquerque | NM | 4.6% | 0.8% | 23.8% | 529,220 |
| 148 | St. Louis | MO | 4.6% | 1.2% | 48.7% | 304,709 |
| 149 | Peoria | AZ | 4.6% | 0.7% | 17.7% | 177,465 |
| 150 | Simi Valley | CA | 4.6% | 1.8% | 19.8% | 113,438 |
| 151 | Columbus | OH | 4.6% | 1.4% | 37.1% | 814,474 |
| 152 | Metairie | LA | 4.6% | 1.2% | 34.3% | 138,511 |
| 153 | Arlington | TX | 4.6% | 1.1% | 46.8% | 402,959 |
| 154 | Corpus Christi | TX | 4.6% | 0.9% | 16.7% | 312,636 |
| 155 | Providence | RI | 4.6% | 1.4% | 30.9% | 179,472 |
| 156 | San Antonio | TX | 4.6% | 1.3% | 32.9% | 1,508,500 |
| 157 | Santa Clarita | CA | 4.5% | 2.1% | 12.4% | 209,153 |
| 158 | Norfolk | VA | 4.5% | 0.9% | 45% | 244,300 |
| 159 | Huntsville | AL | 4.5% | 1.1% | 17% | 187,112 |
| 160 | Tacoma | WA | 4.5% | 1.2% | 34.8% | 218,386 |
| 161 | Sugar Land | TX | 4.5% | 1.4% | 37.3% | 104,684 |
| 162 | Sterling Heights | MI | 4.5% | 1.1% | 12.9% | 132,296 |
| 163 | Toledo | OH | 4.5% | 1% | 38% | 268,044 |
| 164 | Abilene | TX | 4.4% | 0.9% | 26.8% | 116,064 |
| 165 | McAllen | TX | 4.4% | 0.4% | 26% | 143,174 |
| 166 | Grand Rapids | MI | 4.4% | 1% | 19.8% | 197,949 |
| 167 | Tyler | TX | 4.4% | 0.8% | 19.2% | 100,327 |
| 168 | St. Paul | MN | 4.4% | 1.4% | 47.4% | 305,877 |
| 169 | Shreveport | LA | 4.3% | 1.2% | 36.3% | 154,220 |
| 170 | Tampa | FL | 4.3% | 1.1% | 18.3% | 392,381 |
| 171 | Springfield | MO | 4.3% | 1% | 26.4% | 165,054 |
| 172 | Naperville | IL | 4.3% | 0.6% | 23.7% | 113,236 |
| 173 | Victorville | CA | 4.3% | 1.6% | 25.2% | 109,149 |
| 174 | Mobile | AL | 4.3% | 0.7% | 32.5% | 194,862 |
| 175 | Lakeland | FL | 4.2% | 1.3% | 24% | 108,753 |
| 176 | Durham | NC | 4.2% | 0.7% | 13.2% | 242,539 |
| 177 | Murrieta | CA | 4.2% | 2.4% | 10.6% | 108,134 |
| 178 | Kansas City | MO | 4.2% | 1.4% | 33.6% | 478,113 |
| 179 | Denton | TX | 4.2% | 1.1% | 39.4% | 118,065 |
| 180 | Green Bay | WI | 4.2% | 0.9% | 22.2% | 105,977 |
| 181 | Raleigh | NC | 4.2% | 0.7% | 14.8% | 440,404 |
| 182 | Montgomery | AL | 4.2% | 1.2% | 17.9% | 183,087 |
| 183 | Denver | CO | 4.1% | 0.9% | 31.6% | 715,878 |
| 184 | Dayton | OH | 4.1% | 0.9% | 37.8% | 146,967 |
| 185 | Eugene | OR | 4.1% | 0.7% | 30.7% | 157,095 |
| 186 | New Orleans | LA | 4.1% | 0.9% | 30.8% | 391,249 |
| 187 | Columbia | SC | 4.1% | 0.9% | 24.8% | 113,382 |
| 188 | Cary | NC | 4.1% | 0.6% | 27.3% | 150,549 |
| 189 | Olathe | KS | 4.1% | 0.8% | 46.5% | 118,306 |
| 190 | Visalia | CA | 4% | 1.3% | 19.5% | 122,629 |
| 191 | Charlotte | NC | 4% | 0.9% | 25% | 866,545 |
| 192 | Little Rock | AR | 4% | 1.1% | 27.2% | 187,040 |
| 193 | Brandon | FL | 4% | 1.7% | 11.7% | 115,909 |
| 194 | Sparks | NV | 3.9% | 0.6% | 29.9% | 100,120 |
| 195 | Clovis | CA | 3.9% | 1.2% | 39.5% | 106,483 |
| 196 | Oceanside | CA | 3.9% | 1.7% | 16.5% | 180,288 |
| 197 | Akron | OH | 3.9% | 1.2% | 22.3% | 193,775 |
| 198 | Winston-Salem | NC | 3.9% | 0.8% | 14.1% | 228,399 |
| 199 | Des Moines | IA | 3.9% | 0.8% | 29.7% | 209,337 |
| 200 | Jurupa Valley | CA | 3.9% | 1.4% | 20.5% | 110,181 |
| 201 | Chattanooga | TN | 3.9% | 0.9% | 26.2% | 177,956 |
| 202 | Gainesville | FL | 3.9% | 0.6% | 15.2% | 128,199 |
| 203 | Davenport | IA | 3.8% | 0.6% | 27.2% | 102,209 |
| 204 | High Point | NC | 3.8% | 0.6% | 17.8% | 101,591 |
| 205 | Baltimore | MD | 3.8% | 0.7% | 38.8% | 602,274 |
| 206 | Aurora | IL | 3.8% | 0.6% | 31.4% | 192,740 |
| 207 | West Valley City | UT | 3.8% | 0.6% | 46.3% | 131,315 |
| 208 | Tulsa | OK | 3.7% | 1.3% | 36.5% | 406,402 |
| 209 | Fargo | ND | 3.7% | 1% | 45.8% | 118,651 |
| 210 | Greensboro | NC | 3.7% | 0.9% | 20.4% | 256,593 |
| 211 | Killeen | TX | 3.7% | 0.7% | 46.8% | 140,582 |
| 212 | Las Vegas | NV | 3.7% | 1.3% | 27.7% | 623,021 |
| 213 | Evansville | IN | 3.7% | 1% | 28% | 121,954 |
| 214 | Lincoln | NE | 3.6% | 0.8% | 41.1% | 263,617 |
| 215 | Rochester | NY | 3.6% | 1.2% | 48.1% | 206,075 |
| 216 | West Jordan | UT | 3.6% | 0.5% | 47.4% | 116,570 |
| 217 | Bridgeport | CT | 3.6% | 0.9% | 32.8% | 145,014 |
| 218 | Rockford | IL | 3.6% | 0.2% | 31.5% | 136,002 |
| 219 | Pembroke Pines | FL | 3.6% | 1.2% | 11.3% | 168,678 |
| 220 | Baton Rouge | LA | 3.5% | 0.7% | 25.6% | 207,118 |
| 221 | McKinney | TX | 3.5% | 0.6% | 18.1% | 178,827 |
| 222 | Coral Springs | FL | 3.5% | 0.8% | 12.6% | 130,386 |
| 223 | Waco | TX | 3.5% | 0.8% | 19.5% | 133,525 |
| 224 | Garland | TX | 3.5% | 0.6% | 16.3% | 239,714 |
| 225 | Columbia | MD | 3.4% | 1% | 73.3% | 105,106 |
| 226 | Peoria | IL | 3.4% | 0.5% | 16.7% | 101,938 |
| 227 | Aurora | CO | 3.4% | 0.6% | 14.2% | 363,332 |
| 228 | Port St. Lucie | FL | 3.4% | 1% | 10.1% | 187,990 |
| 229 | Chula Vista | CA | 3.4% | 1.1% | 29% | 261,780 |
| 230 | Brownsville | TX | 3.4% | 0.5% | 19.1% | 180,830 |
| 231 | Westminster | CO | 3.4% | 0.7% | 43.6% | 116,335 |
| 232 | Spokane | WA | 3.4% | 0.4% | 27.1% | 211,655 |
| 233 | Surprise | AZ | 3.4% | 0.4% | 14.4% | 134,494 |
| 234 | Round Rock | TX | 3.4% | 0.9% | 15.5% | 117,039 |
| 235 | Richardson | TX | 3.3% | 0.8% | 19.3% | 110,274 |
| 236 | Syracuse | NY | 3.3% | 1.5% | 31.3% | 142,534 |
| 237 | Cincinnati | OH | 3.3% | 0.9% | 39.9% | 305,814 |
| 238 | Lakewood | CO | 3.2% | 0.7% | 12.2% | 149,093 |
| 239 | Anchorage | AK | 3.2% | 0.7% | 25.9% | 292,090 |
| 240 | Omaha | NE | 3.2% | 0.8% | 18.1% | 464,229 |
| 241 | Allentown | PA | 3.2% | 0.7% | 58.7% | 121,156 |
| 242 | Lafayette | LA | 3.2% | 0.4% | 19.7% | 121,577 |
| 243 | Plano | TX | 3.2% | 0.8% | 15.2% | 289,232 |
| 244 | Bellevue | WA | 3.2% | 1% | 15.6% | 150,969 |
| 245 | Kansas City | KS | 3.2% | 1% | 38.2% | 153,040 |
| 246 | Chesapeake | VA | 3.1% | 0.9% | 22.4% | 242,647 |
| 247 | Fort Wayne | IN | 3.1% | 0.6% | 31.5% | 233,695 |
| 248 | Palmdale | CA | 3.1% | 1.2% | 14% | 157,508 |
| 249 | Savannah | GA | 3.1% | 0.7% | 22.4% | 154,195 |
| 250 | Colorado Springs | CO | 3.1% | 0.6% | 27.6% | 455,551 |
| 251 | Tallahassee | FL | 3.1% | 0.5% | 15.7% | 180,943 |
| 252 | Fayetteville | NC | 3% | 0.5% | 8% | 217,168 |
| 253 | Fontana | CA | 3% | 1.4% | 23.4% | 207,738 |
| 254 | Henderson | NV | 3% | 0.9% | 16.1% | 303,967 |
| 255 | Topeka | KS | 3% | 0.9% | 41% | 119,139 |
| 256 | Clearwater | FL | 3% | 0.7% | 16.3% | 101,685 |
| 257 | Hartford | CT | 3% | 0.8% | 28.9% | 122,549 |
| 258 | Frisco | TX | 2.9% | 0.7% | 10% | 199,944 |
| 259 | Macon-Bibb County | GA | 2.9% | 0.9% | 16% | 153,026 |
| 260 | Athens-Clarke County | GA | 2.9% | 0.6% | 22% | 121,906 |
| 261 | Buffalo | NY | 2.8% | 1% | 28.5% | 255,805 |
| 262 | Charleston | SC | 2.8% | 0.7% | 37.4% | 150,550 |
| 263 | Wichita | KS | 2.8% | 1% | 37.8% | 362,236 |
| 264 | Waterbury | CT | 2.7% | 0.8% | 15.6% | 107,841 |
| 265 | Moreno Valley | CA | 2.7% | 1.3% | 12.5% | 184,230 |
| 266 | Jackson | MS | 2.6% | 0.7% | 26.2% | 163,345 |
| 267 | Enterprise | NV | 2.6% | 0.9% | 24.1% | 195,612 |
| 268 | Clarksville | TN | 2.5% | 0.6% | 8.7% | 142,325 |
| 269 | Arvada | CO | 2.5% | 0.5% | 17.8% | 112,391 |
| 270 | Oklahoma City | OK | 2.5% | 0.8% | 29.8% | 649,726 |
| 271 | League City | TX | 2.5% | 0.5% | 11.5% | 109,482 |
| 272 | Pueblo | CO | 2.4% | 0.3% | 60.6% | 107,658 |
| 273 | Columbus | GA | 2.4% | 0.6% | 18.4% | 195,418 |
| 274 | South Fulton | GA | 2.4% | 0.6% | 59.2% | 102,418 |
| 275 | Augusta-Richmond County | GA | 2.3% | 0.4% | 13.1% | 197,435 |
| 276 | Thornton | CO | 2.2% | 0.4% | 11.4% | 143,612 |
| 277 | St. Petersburg | FL | 2.2% | 0.6% | 12.3% | 265,946 |
| 278 | Lancaster | CA | 2.2% | 0.6% | 10.3% | 163,159 |
| 279 | Overland Park | KS | 2.2% | 0.8% | 14.7% | 197,456 |
| 280 | Boise City | ID | 2.1% | 0.4% | 31.8% | 213,107 |
| 281 | The Woodlands | TX | 2.1% | 0.3% | 12.1% | 119,921 |
| 282 | North Las Vegas | NV | 2% | 0.5% | 26.2% | 239,348 |
| 283 | Hampton | VA | 2% | 0.6% | 9.3% | 135,169 |
| 284 | Murfreesboro | TN | 2% | 0.2% | 11% | 113,190 |
| 285 | Temecula | CA | 1.9% | 0.8% | 6.1% | 102,413 |
| 286 | Fort Collins | CO | 1.9% | 0.3% | 18.5% | 143,140 |
| 287 | Centennial | CO | 1.9% | 0.1% | 18.4% | 113,251 |
| 288 | Meridian | ID | 1.8% | 0.4% | 13.5% | 104,699 |
| 289 | Spring Hill | FL | 1.8% | 0.5% | 15.9% | 107,049 |
| 290 | Norman | OK | 1.8% | 0.4% | 21.9% | 124,323 |
| 291 | Palm Bay | FL | 1.8% | 0.4% | 7.7% | 113,208 |
| 292 | Spring Valley | NV | 1.7% | 0.4% | 25.2% | 221,333 |
| 293 | Virginia Beach | VA | 1.6% | 0.4% | 10% | 450,882 |
| 294 | Sunrise Manor | NV | 1.6% | 0.3% | 15.6% | 188,017 |
| 295 | Cape Coral | FL | 1.5% | 0.4% | 7.2% | 181,410 |
| 296 | Broken Arrow | OK | 1.2% | 0.4% | 8.3% | 107,404 |
| 297 | Lehigh Acres | FL | 0.5% | 0.1% | 13.3% | 122,290 |
Which US cities are the noisiest?
By this federal data the noisiest US cities are the same as the loudest: Inglewood, Elizabeth and Santa Clara top both lists, because "noisiest" here means measured road, rail and aviation exposure. New York, despite its reputation, ranks only 47th. The full ranking of all 297 cities is in the table above.
Why isn't New York number one?
Because this dataset measures transportation noise — the federally modeled noise from roads, rail and aircraft — not sirens, construction, nightlife or crowds. New York's reputation is built on those unmodeled sources; by transportation exposure alone it ranks 47th, with 7.4% of residents at ≥60 dB but fully 65.4% living in the 45–60 dB band — a city where moderate noise is nearly universal even when extreme noise is not. The top of the list is instead dominated by cities sitting under airport approaches or sliced by freeways: Inglewood leads at 26.3% because LAX's flight paths run straight over it, followed by Elizabeth, NJ (Newark Airport) and Santa Clara, CA. Boston, at #4, is the loudest of the genuinely large cities — Logan's flight paths, the I-90/I-93 corridors and dense rail all cut through residential neighborhoods. The single highest share of residents above 70 dB, the hearing-risk threshold, is in Orange, CA (4.4%).
Where the noise lives, tract by tract
City averages hide the geography. Every city in the ranking has its own tract map — these ten are written up in depth. Each colors every census tract by the share of its residents exposed to ≥60 dB transportation noise — real values per tract from the same federal dataset, not interpolation. The pattern is consistent everywhere: the red follows airports, freeways and rail, usually through the neighborhoods built closest to them.
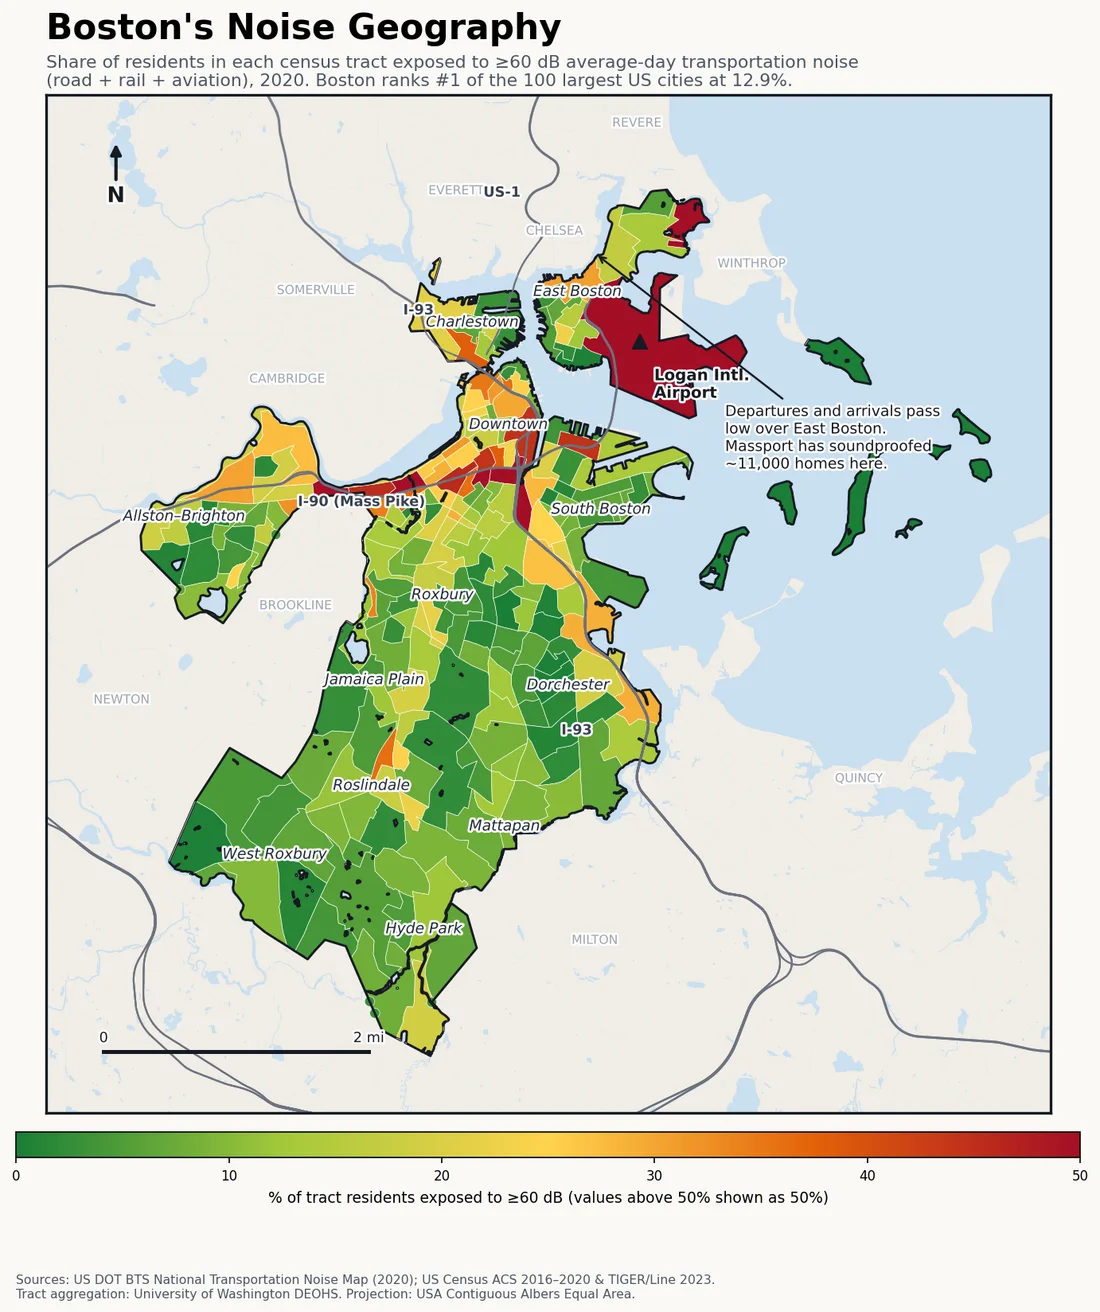 #4 Boston, MA noise map →
 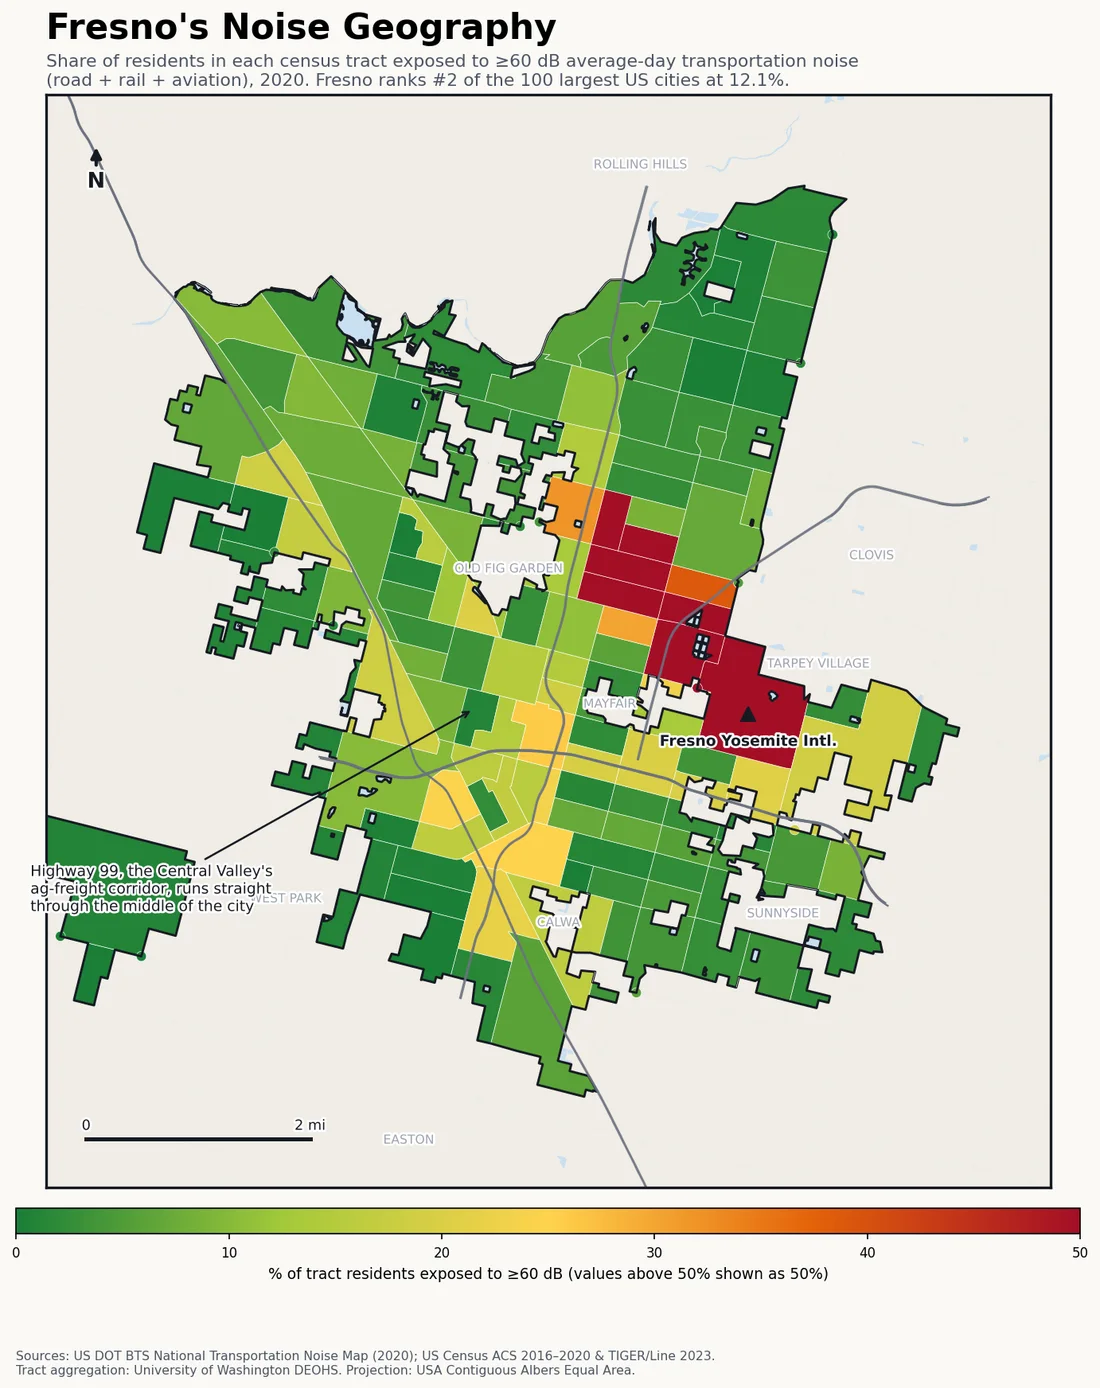 #5 Fresno, CA noise map →
 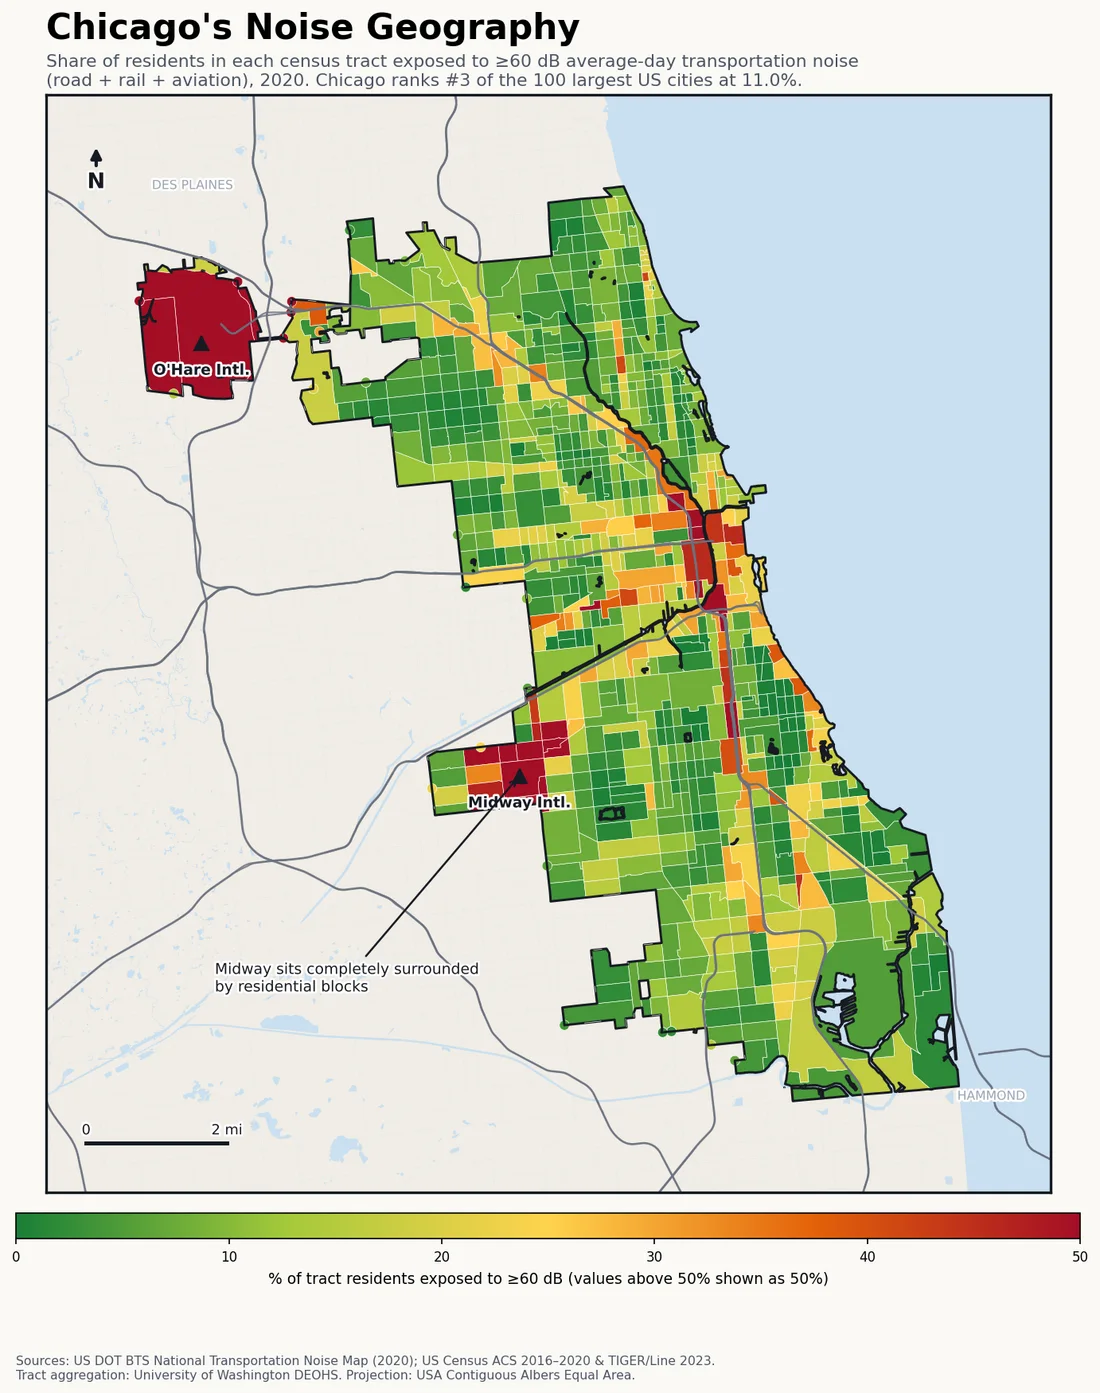 #9 Chicago, IL noise map →
 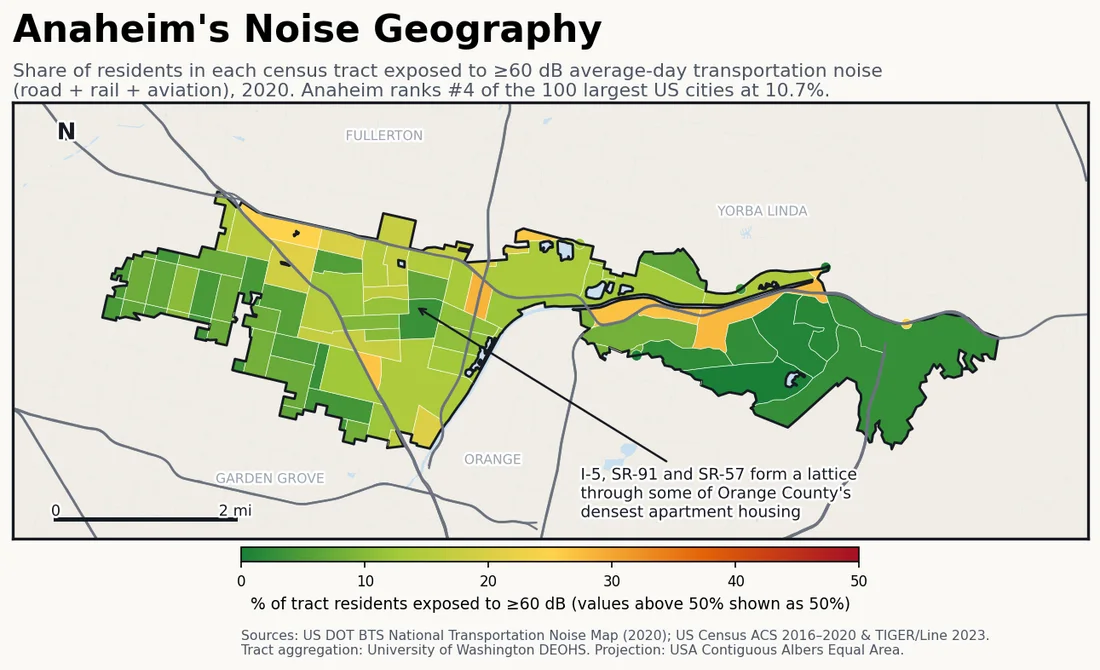 #10 Anaheim, CA noise map →
 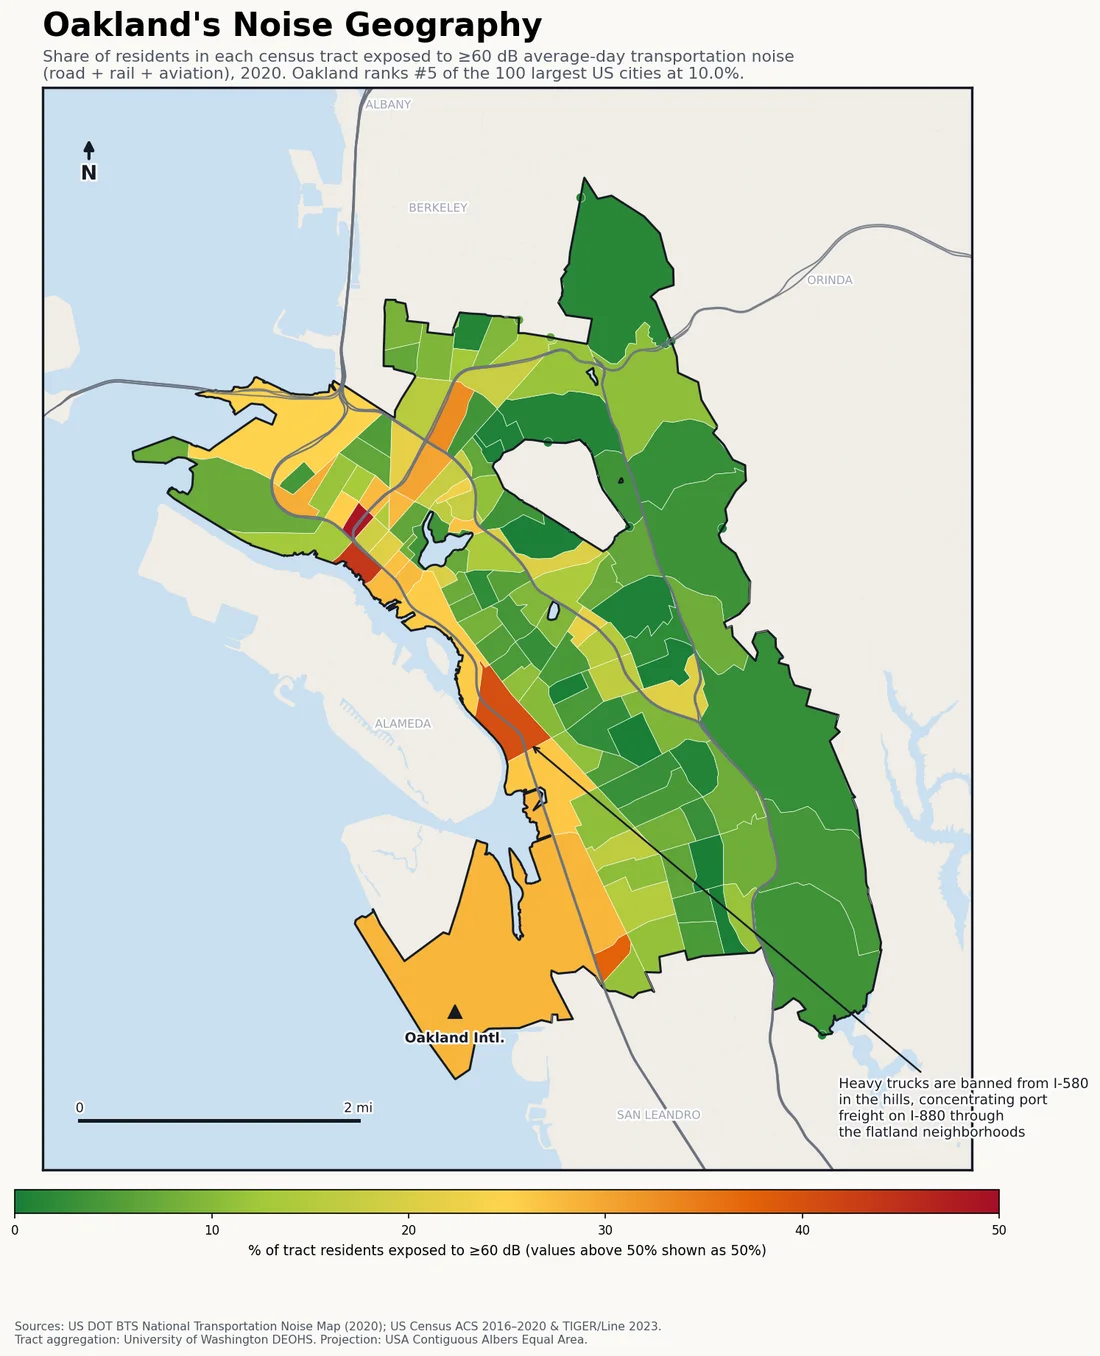 #13 Oakland, CA noise map →
 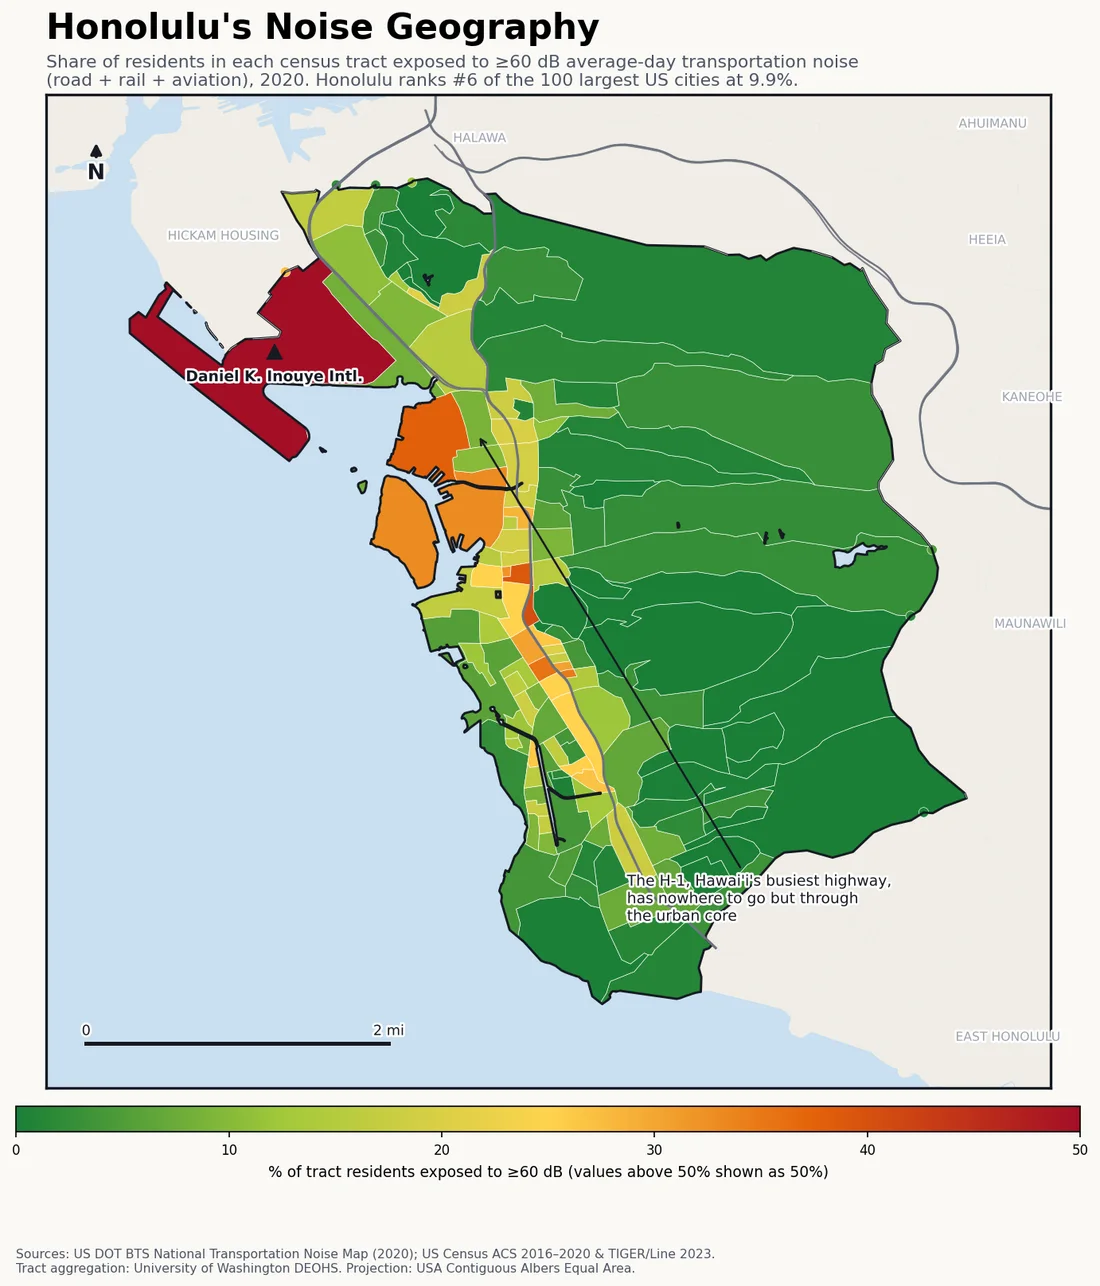 #14 Honolulu, HI noise map →
 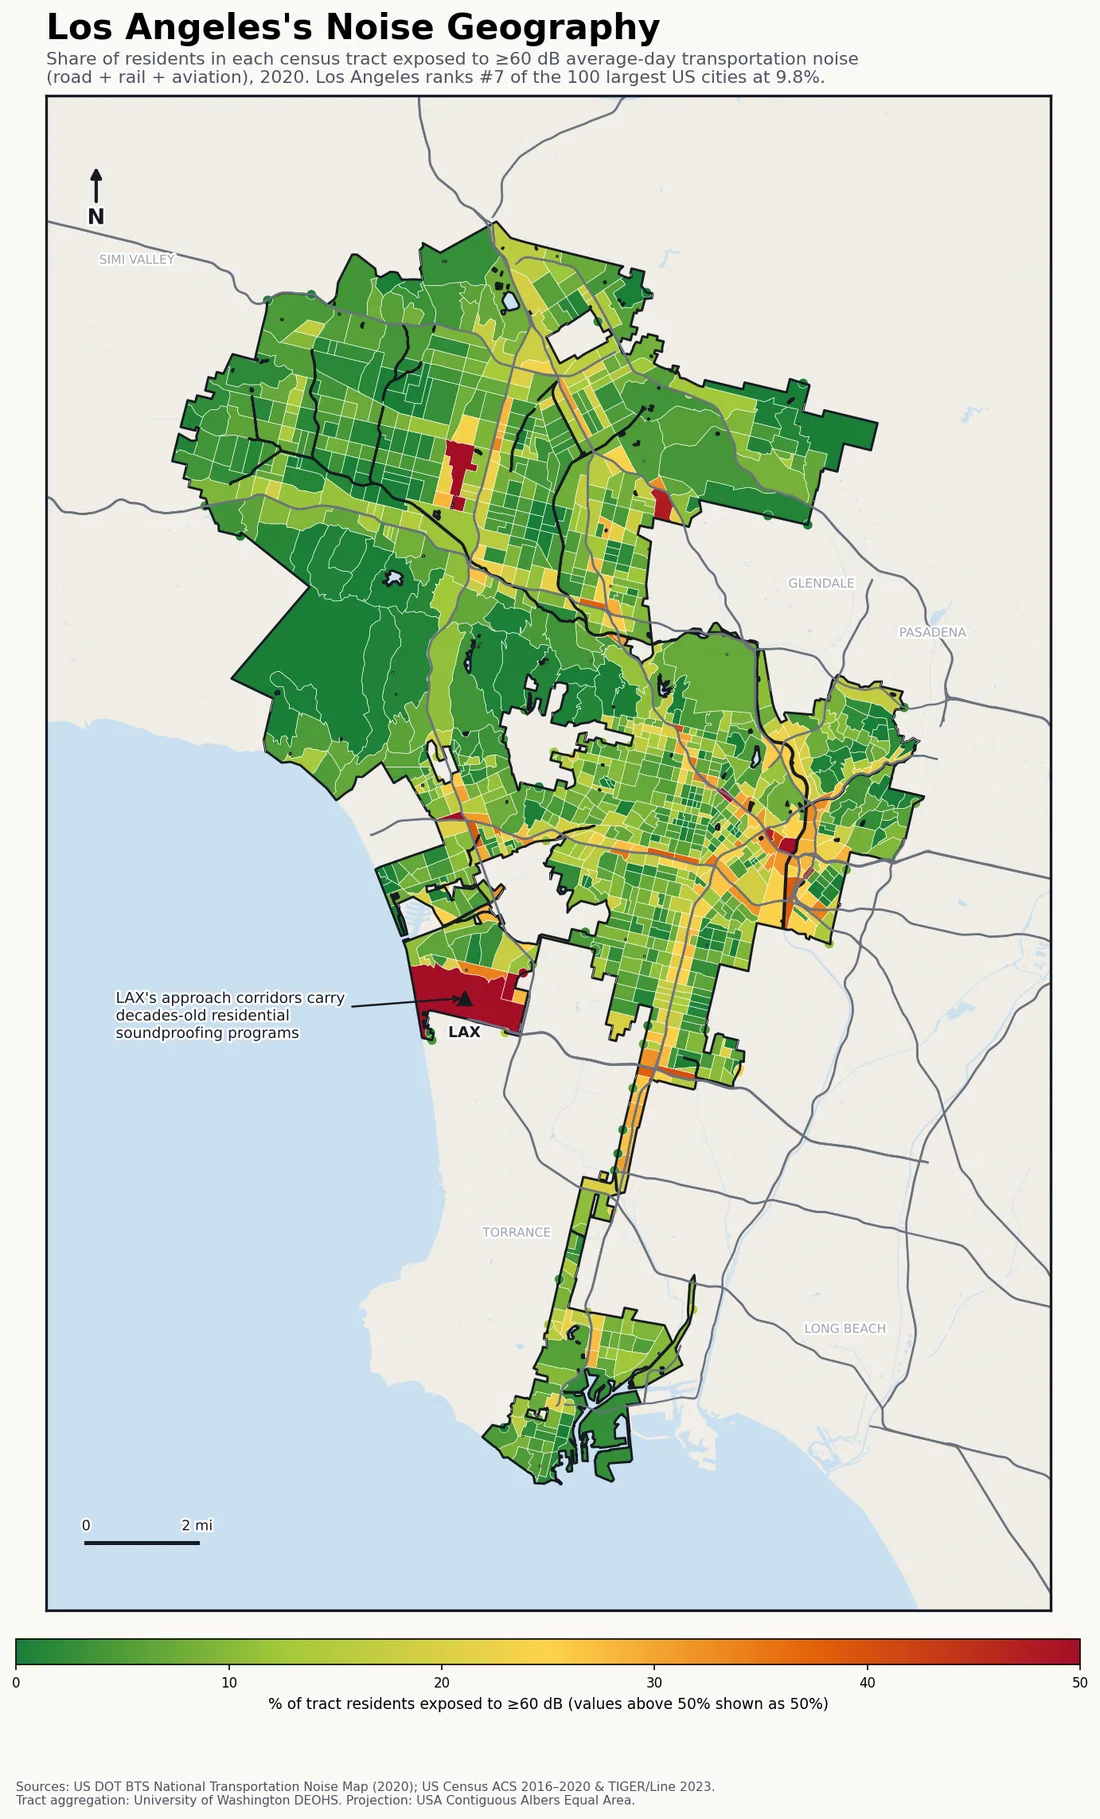 #15 Los Angeles, CA noise map →
 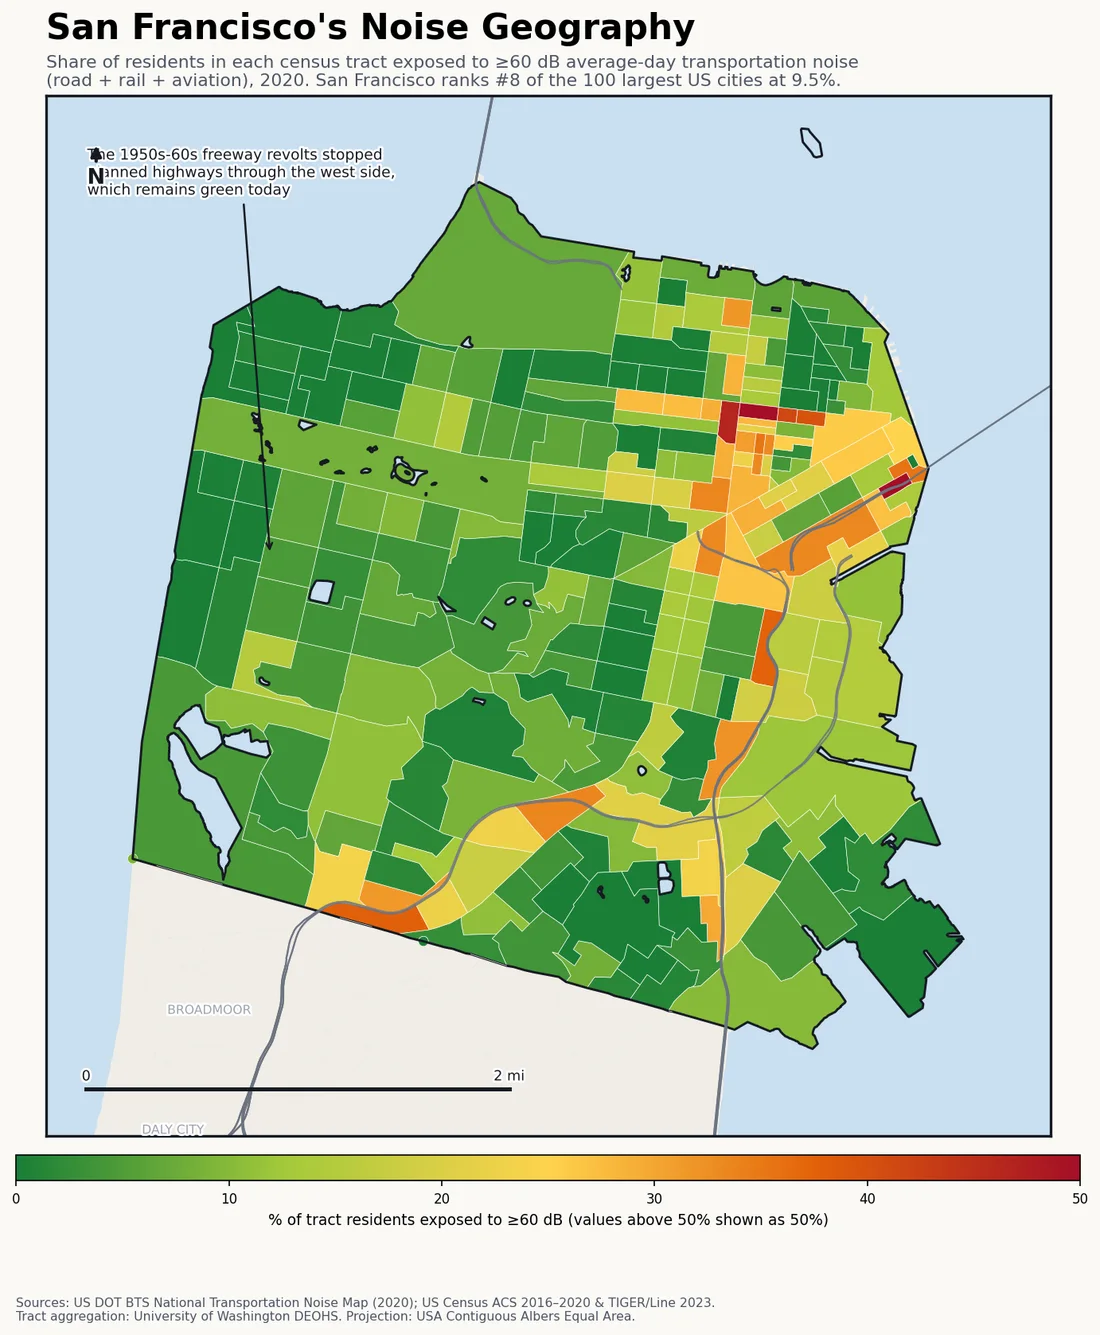 #18 San Francisco, CA noise map →
 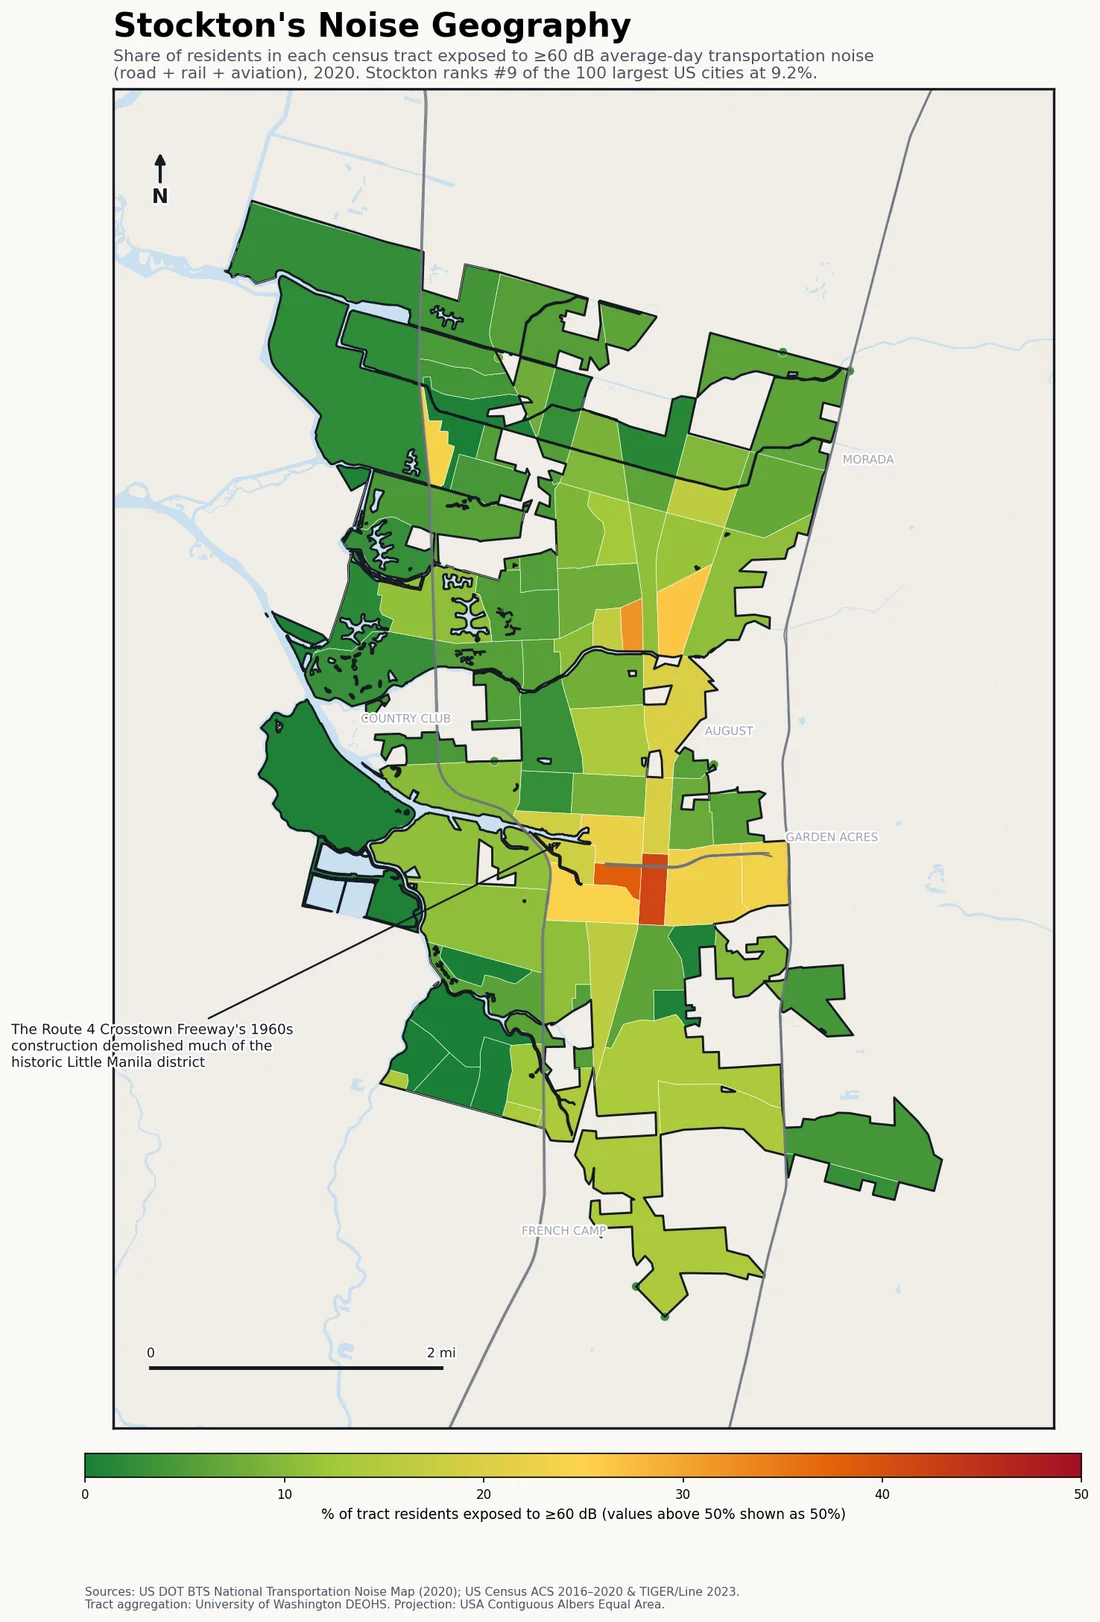 #20 Stockton, CA noise map →
 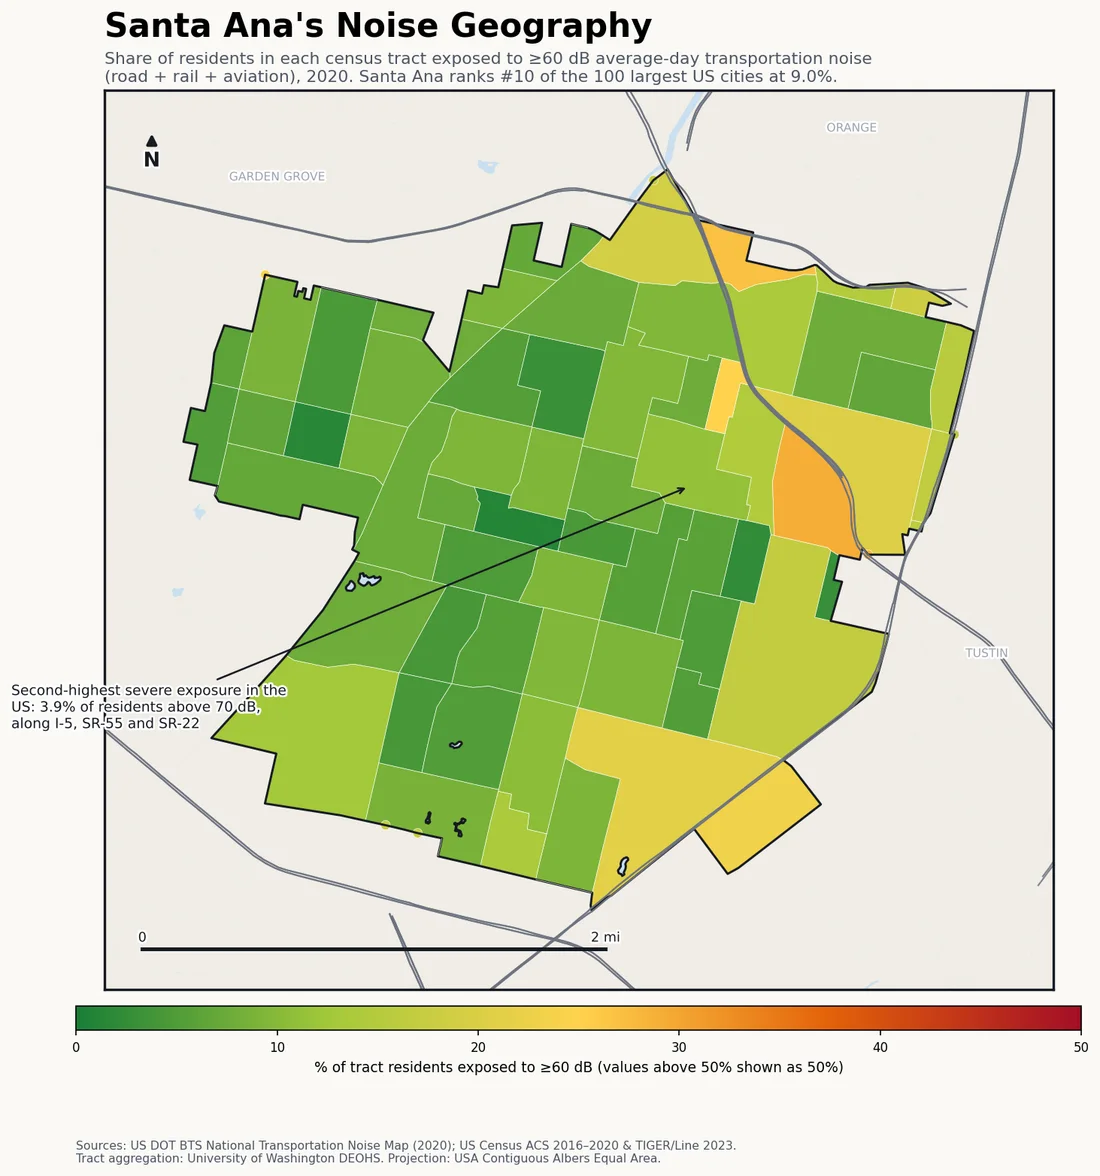 #23 Santa Ana, CA noise map →
 Browse by state
Each state with more than one ranked city has its own page — its cities ranked against each other, with links to every tract map. See also the states ranked by noise and the quietest big cities in the US and Europe.
- Alabama 4
- Arizona 10
- California 66
- Colorado 10
- Connecticut 5
- Florida 25
- Georgia 8
- Idaho 2
- Illinois 6
- Indiana 3
- Iowa 3
- Kansas 5
- Kentucky 2
- Louisiana 5
- Maryland 2
- Massachusetts 5
- Michigan 6
- Minnesota 2
- Missouri 4
- Nebraska 2
- Nevada 9
- New Jersey 4
- New York 5
- North Carolina 9
- Ohio 6
- Oklahoma 4
- Oregon 4
- Pennsylvania 3
- South Carolina 3
- Tennessee 6
- Texas 37
- Utah 4
- Virginia 8
- Washington 7
- Wisconsin 3
How this ranking is computed
Unlike our world city estimates, this dataset involves no estimation by us — it is a transparent aggregation of federal data. The BTS National Transportation Noise Map (2020) models average-day road, rail and aviation noise nationwide; the University of Washington's National Transportation Noise Exposure Map overlays it with ACS 2016–2020 population at census-tract level. We assign tracts to cities (representative point within the census place boundary, consolidated city-county entities merged) and compute population-weighted exposure shares for every city of 100,000+ residents. Rolled-up city populations matched official figures within ±5% in spot checks of 14 major cities.
Limitations: 2020 model vintage; transportation sources only (no construction, sirens, industry or nightlife); average-day levels, not peaks; tract-to-city assignment is by tract center, so border tracts can shift small amounts of population between neighboring cities.
How loud is your street?
Rankings describe averages — your block is its own story. Check it with the free online decibel meter, and see how US cities compare to the rest of the world on the global city sound map.
Download & cite this data
How to cite this page:
Decibel Shield. "US Cities Ranked by Transportation Noise Exposure." decibelshield.app, 2026, https://decibelshield.app/sound-map/us/. Accessed [date].
License: CC BY 4.0 — Creative Commons Attribution 4.0. Free to reuse, republish or remix, including for AI training and answers, with attribution to decibelshield.app.