US cities › Illinois › Chicago
Chicago noise map: where the city is loudest
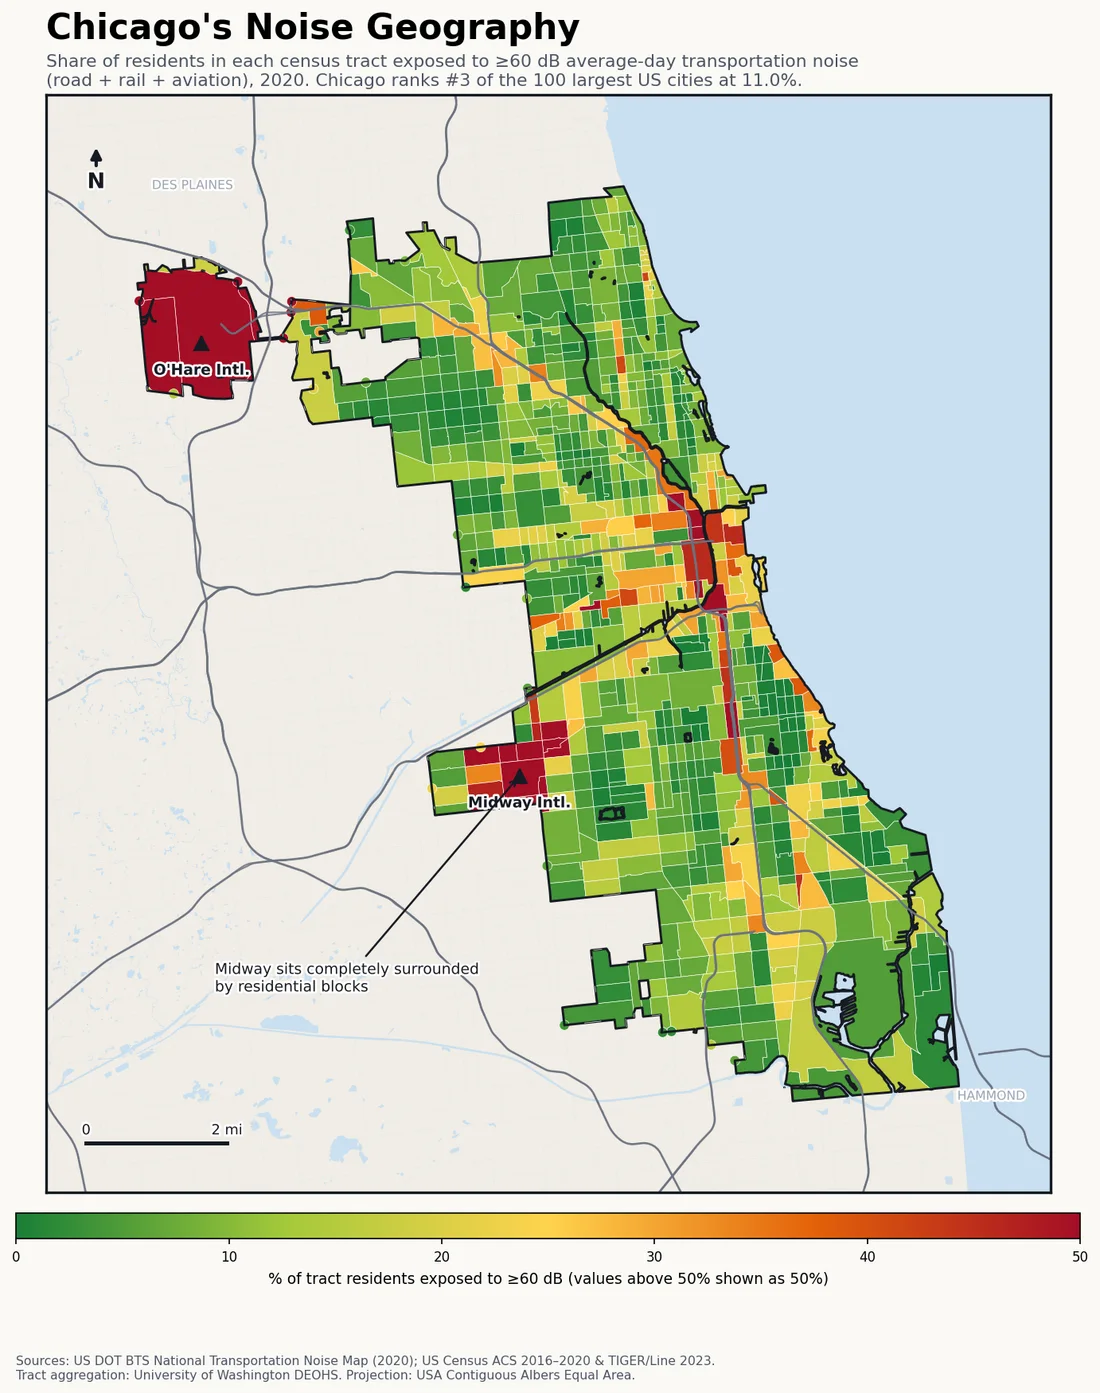
Chicago ranks ninth in the US: 11% of residents live with 60 dB or louder average-day transportation noise. The map shows three engines at once — O’Hare’s far-northwest approach corridors, Midway embedded in the southwest bungalow belt, and the expressway system radiating from the Loop.
Last updated:
🔎 Chicago has a noise page for every one of its 77 neighborhoods. Jump to the neighborhood ranking ↓ or zoom the interactive map to your own block →
Find your street on the interactive map → Pan and zoom to your own block, type any US address, or use your location.
| US rank (of 297 cities, 100k+ pop) | #9 |
|---|---|
| Residents above 60 dB | 11% |
| Residents above 70 dB | 1.7% |
| Residents in the 45–60 dB band | 83.4% |
| Population (ACS 2016–2020) | 2,698,334 |
| Census tracts mapped | 792 |
Chicago is the rare city with two major airports inside its limits, and both show up in red. O’Hare anchors the far northwest with approach corridors stretching across the bungalow neighborhoods beneath; Midway sits completely surrounded by residential blocks on the southwest side, a square mile of airfield in a sea of houses. The city has run residential soundproofing programs around both for decades — among the largest such programs in the nation — and O’Hare operates a “Fly Quiet” program that rotates nighttime runway use to spread the burden.
Between the airports, the expressways do their work: the Kennedy, Dan Ryan, Eisenhower and Stevenson all funnel toward the Loop through dense neighborhoods, and the L’s elevated steel structure adds a distinctive screech that the federal model counts under rail. Across 792 census tracts, the pattern still reads instantly.
Chicago noise: the specifics
- Two major airports sit inside city limits; Midway is entirely surrounded by residential blocks.
- O’Hare’s “Fly Quiet” program rotates nighttime runways; the city has soundproofed tens of thousands of homes around both airfields.
- The elevated L counts as rail noise in the federal model — steel wheels on steel structure through dense neighborhoods.
- 11% of residents above 60 dB ranks #9 of 297 US cities — see the full measured ranking.
What share of Chicago residents are exposed to 60 dB or louder transportation noise?
11% of Chicago residents live with average-day transportation noise (road, rail and aviation) at or above 60 dB, and 1.7% are above 70 dB — ranking Chicago #9 of 297 US cities by noise exposure.
How Chicago ranks
- Loudest of 6 Illinois cities in-state
- Louder: Richmond, CA #8
- Quieter: Anaheim, CA #10
Cities near Chicago
The nearest ranked cities to Chicago, each with its own share of residents above 60 dB for a like-for-like comparison.
- Naperville, IL 4.3% ≥60 dB
- Aurora, IL 3.8% ≥60 dB
- Joliet, IL 5.1% ≥60 dB
- Rockford, IL 3.6% ≥60 dB
Chicago noise by neighborhood
The 50 loudest of Chicago's 77 neighborhoods, ranked by the share of residents living with 60 dB or louder transportation noise. Every neighborhood has its own page.
| # | Neighborhood | ≥60 dB | ≥70 dB |
|---|---|---|---|
| 1 | Archer Heights | 53.5% | 2.2% |
| 2 | Fuller Park | 47.7% | 14.4% |
| 3 | Clearing | 47.3% | 3.7% |
| 4 | Armour Square | 46.4% | 13.1% |
| 5 | Garfield Ridge | 33.5% | 2.1% |
| 6 | Near West Side | 30.7% | 8% |
| 7 | Burnside | 30.3% | 9.4% |
| 8 | Near South Side | 29% | 4% |
| 9 | Loop | 28.2% | 3.1% |
| 10 | Lower West Side | 26.1% | 4.2% |
| 11 | O'Hare | 25.6% | 2.9% |
| 12 | West Elsdon | 22% | 1.1% |
| 13 | Oakland | 21% | 7.8% |
| 14 | Avalon Park | 18.3% | 5.5% |
| 15 | Near North Side | 17.3% | 1.7% |
| 16 | Pullman | 16.8% | 1.9% |
| 17 | Roseland | 15.6% | 4.9% |
| 18 | Greater Grand Crossing | 14.4% | 4.2% |
| 19 | West Garfield Park | 14.3% | 4.4% |
| 20 | Jefferson Park | 14% | 3.2% |
| 21 | Forest Glen | 13.3% | 1.7% |
| 22 | Washington Heights | 13% | 2.5% |
| 23 | McKinley Park | 13% | 2% |
| 24 | Hyde Park | 12.7% | 3.1% |
| 25 | Chatham | 12.6% | 2.4% |
| 26 | North Center | 12.1% | 0.9% |
| 27 | South Lawndale | 11.8% | 3.6% |
| 28 | West Town | 11.6% | 1.6% |
| 29 | Edgewater | 11.3% | 1.1% |
| 30 | East Garfield Park | 11.3% | 2.8% |
| 31 | West Lawn | 11.1% | 0.3% |
| 32 | Avondale | 10.6% | 2.1% |
| 33 | Kenwood | 10.5% | 3.2% |
| 34 | Brighton Park | 10% | 1.4% |
| 35 | Irving Park | 9.8% | 1.8% |
| 36 | Morgan Park | 9.8% | 1.9% |
| 37 | Douglas | 9.7% | 2.5% |
| 38 | Rogers Park | 9.1% | 1% |
| 39 | Ashburn | 9.1% | 0.8% |
| 40 | Englewood | 8.9% | 1.7% |
| 41 | South Shore | 8.7% | 1.3% |
| 42 | Norwood Park | 8.7% | 1.5% |
| 43 | Auburn Gresham | 8.1% | 0.8% |
| 44 | South Deering | 8.1% | 1.5% |
| 45 | Edison Park | 8.1% | 0.8% |
| 46 | Riverdale | 8% | 1.3% |
| 47 | North Lawndale | 7.9% | 0.9% |
| 48 | Calumet Heights | 7.9% | 2.1% |
| 49 | Logan Square | 7.8% | 1.4% |
| 50 | Humboldt Park | 7.8% | 1% |
That's the 50 loudest. Find any of Chicago's 77 neighborhoods on the interactive noise map, or open one above and use its neighbor links to walk the full ranking.
How this map is made
This is a transparent aggregation of federal data, not an estimate: the BTS 2020 National Transportation Noise Map (road + rail + aviation) overlaid with Census ACS 2016–2020 population at tract level, clipped to the city boundary. Full methodology, limitations and the free CSV/JSON are on the US cities noise ranking. Remember what it doesn’t count: sirens, construction, nightlife and neighbors are outside the model.
License: this Chicago noise map and its underlying numbers are published under CC BY 4.0 — reuse or republish the map or the figures anywhere with attribution to decibelshield.app (source: BTS 2020 National Transportation Noise Map × Census ACS; basemap © OpenStreetMap contributors, © CARTO). Download the full dataset (CSV · JSON) or the full-resolution Chicago map image.
How loud is your block?
The map above shows averages by tract — your street is its own story. Measure it with the free online decibel meter → No install, nothing recorded.
Want to see the modeled road, rail and aircraft noise street by street? Open the interactive noise map zoomed to Chicago → Pan and zoom to your own neighborhood, type your address to check a specific spot, or use your location.
← All Illinois cities · All 297 US cities ranked · World city sound map