US cities › California › Anaheim
Anaheim noise map: where the city is loudest
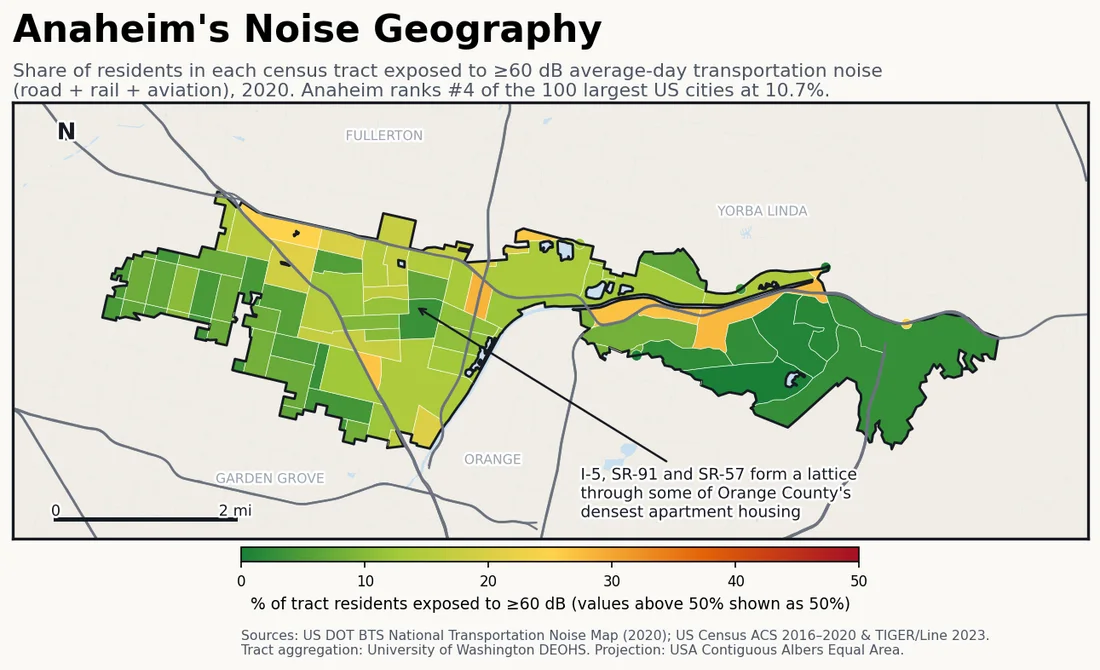
Anaheim has one of the highest severe-noise shares in the country: 4.2% of residents live above 70 dB, and 10.7% above 60 dB, ranking tenth overall. Three freeways — I-5, SR-91 and SR-57 — form a lattice through a city of dense, freeway-adjacent apartment housing.
Last updated:
Find your street on the interactive map → Pan and zoom to your own block, type any US address, or use your location.
| US rank (of 297 cities, 100k+ pop) | #10 |
|---|---|
| Residents above 60 dB | 10.7% |
| Residents above 70 dB | 4.2% |
| Residents in the 45–60 dB band | 31.5% |
| Population (ACS 2016–2020) | 333,887 |
| Census tracts mapped | 59 |
Anaheim’s distinction isn’t its overall ranking — it’s the severity. Among large US cities, few have a bigger share of residents above 70 dB, the level federal agencies treat as a serious threshold (only smaller Orange County neighbors like Orange and Norwalk edge it out). The geometry explains it: I-5 cuts diagonally through the city’s heart, SR-91 runs the full east–west width, and SR-57 closes the triangle, with some of Orange County’s densest apartment stock built directly along the corridors.
The map has one famous omission. Disneyland’s nightly fireworks are a defining feature of Anaheim’s actual soundscape — audible across a swath of the city nearly every evening — but the federal model counts only road, rail and aviation, so they don’t register a single decibel here. Anaheim is a clean illustration of what transportation-noise data measures, and what it doesn’t.
Anaheim noise: the specifics
- Among the highest severe-exposure shares of any large US city: 4.2% of residents above 70 dB — topped only by smaller Orange County neighbors.
- Three freeways (I-5, SR-91, SR-57) form a lattice through the city, with dense apartment housing along the corridors.
- Disneyland’s nightly fireworks — a real fixture of local noise — are invisible to the federal model, which counts only transportation sources.
- 10.7% of residents above 60 dB ranks #10 of 297 US cities — see the full measured ranking.
What share of Anaheim residents are exposed to 60 dB or louder transportation noise?
10.7% of Anaheim residents live with average-day transportation noise (road, rail and aviation) at or above 60 dB, and 4.2% are above 70 dB — ranking Anaheim #10 of 297 US cities by noise exposure.
How Anaheim ranks
- #7 of 66 California cities in-state
- Louder: Chicago, IL #9
- Quieter: Orange, CA #11
Cities near Anaheim
The nearest ranked cities to Anaheim, each with its own share of residents above 60 dB for a like-for-like comparison.
- Orange, CA 10.3% ≥60 dB
- Fullerton, CA 8.5% ≥60 dB
- Santa Ana, CA 9% ≥60 dB
- Garden Grove, CA 8.2% ≥60 dB
How this map is made
This is a transparent aggregation of federal data, not an estimate: the BTS 2020 National Transportation Noise Map (road + rail + aviation) overlaid with Census ACS 2016–2020 population at tract level, clipped to the city boundary. Full methodology, limitations and the free CSV/JSON are on the US cities noise ranking. Remember what it doesn’t count: sirens, construction, nightlife and neighbors are outside the model.
License: this Anaheim noise map and its underlying numbers are published under CC BY 4.0 — reuse or republish the map or the figures anywhere with attribution to decibelshield.app (source: BTS 2020 National Transportation Noise Map × Census ACS; basemap © OpenStreetMap contributors, © CARTO). Download the full dataset (CSV · JSON) or the full-resolution Anaheim map image.
How loud is your block?
The map above shows averages by tract — your street is its own story. Measure it with the free online decibel meter → No install, nothing recorded.
Want to see the modeled road, rail and aircraft noise street by street? Open the interactive noise map zoomed to Anaheim → Pan and zoom to your own neighborhood, type your address to check a specific spot, or use your location.
← All California cities · All 297 US cities ranked · World city sound map