The loudest cities in Europe, ranked by noise exposure
Across 314 European agglomerations measured under the EU Environmental Noise Directive, Terni, Italy ranks loudest by day-evening-night (Lden) transport-noise exposure, followed by Bacau and Messina. These are measured EEA figures (2022 round) — road, rail, aircraft and industry — not estimates.
Last updated:
The ranking: 314 European cities
Each city's measured day-evening-night (Lden) and night (Lnight) transport-noise range for its noise-exposed residents, with the dominant source. Lden is the EU annual-average day-evening-night level; the WHO road-traffic guideline is 53 dB Lden / 45 dB Lnight.
| # | City | Country | Lden | Lnight | Source | Population |
|---|---|---|---|---|---|---|
| 1 | Terni | Italy | 55–75 | 50–70 | Road | 110,940 |
| 2 | Bacau | Romania | 55–75 | 50–65 | Road | 136,087 |
| 3 | Messina | Italy | 55–75 | 50–65 | Road | 220,094 |
| 4 | Bruges | Belgium | 55–75 | 50–65 | Road | 118,509 |
| 5 | Essen | Germany | 55–75 | 50–65 | Road | 581,980 |
| 6 | Solingen | Germany | 55–75 | 50–65 | Road | 159,029 |
| 7 | Pescara | Italy | 55–75 | 50–65 | Road, Rail | 119,445 |
| 8 | Aachen | Germany | 55–75 | 50–65 | Road | 246,443 |
| 9 | Kassel | Germany | 55–75 | 50–65 | Road | 202,689 |
| 10 | Remscheid | Germany | 55–75 | 50–65 | Road | 111,082 |
| 11 | Latina | Italy | 55–75 | 55–65 | Road | 127,861 |
| 12 | Iasi | Romania | 55–75 | 50–65 | Road | 271,692 |
| 13 | Wiesbaden | Germany | 55–75 | 50–65 | Road | 282,903 |
| 14 | Pforzheim | Germany | 55–75 | 50–65 | Road | 125,542 |
| 15 | Saarbruecken | Germany | 55–75 | 50–65 | Road | 183,696 |
| 16 | Vigo | Spain | 55–70 | 50–65 | Road | 291,082 |
| 17 | Vienna | Austria | 55–75 | 45–65 | Road | 1,977,300 |
| 18 | Ghent | Belgium | 55–75 | 50–65 | Road | 265,086 |
| 19 | Rijeka | Croatia | 55–75 | 50–65 | Road | 107,964 |
| 20 | Bonn | Germany | 55–75 | 50–65 | Road | 335,975 |
| 21 | Heilbronn | Germany | 55–75 | 50–65 | Road | 130,870 |
| 22 | Munich | Germany | 55–75 | 50–65 | Road | 1,500,962 |
| 23 | Moenchengladbach | Germany | 55–70 | 50–65 | Road | 270,877 |
| 24 | Graz | Austria | 55–75 | 45–65 | Road | 291,000 |
| 25 | Zagreb | Croatia | 55–75 | 50–65 | Road | 767,131 |
| 26 | Split | Croatia | 55–70 | 50–65 | Road | 160,577 |
| 27 | Ruda Slaska | Poland | 55–70 | 50–65 | Road | 135,695 |
| 28 | Duesseldorf | Germany | 55–75 | 50–65 | Road | 644,000 |
| 29 | Herne | Germany | 55–75 | 50–65 | Road | 161,472 |
| 30 | Osnabrueck | Germany | 55–75 | 50–65 | Road | 168,286 |
| 31 | Reggio Emilia | Italy | 55–70 | 50–65 | Road | 169,029 |
| 32 | Walbrzych | Poland | 55–75 | 50–65 | Road | 108,222 |
| 33 | San Sebastian - Donostia | Spain | 55–70 | 50–60 | Road | 178,446 |
| 34 | Augsburg | Germany | 55–75 | 50–65 | Road | 297,052 |
| 35 | Duisburg | Germany | 55–75 | 50–65 | Road | 498,182 |
| 36 | Berlin | Germany | 55–70 | 50–65 | Road | 3,606,316 |
| 37 | Muelheim on the Ruhr | Germany | 55–75 | 50–65 | Road | 173,255 |
| 38 | Recklinghausen | Germany | 55–75 | 50–65 | Road | 119,435 |
| 39 | Wuppertal | Germany | 55–75 | 50–65 | Road | 361,774 |
| 40 | Luxembourg_south | Luxembourg | 55–75 | 50–65 | Road | 180,449 |
| 41 | Bucharest | Romania | 55–70 | 50–65 | Road | 2,161,347 |
| 42 | Bottrop | Germany | 55–75 | 50–65 | Road | 117,311 |
| 43 | Chemnitz | Germany | 55–75 | 50–65 | Road | 175,193 |
| 44 | Paris | France | 55–70 | 50–65 | Road | 7,068,800 |
| 45 | Bolzano | Italy | 55–70 | 50–65 | Road | 107,879 |
| 46 | Verona | Italy | 55–70 | 50–65 | Road | 258,500 |
| 47 | Gelsenkirchen | Germany | 55–75 | 50–65 | Road | 259,718 |
| 48 | Sassari | Italy | 55–70 | 50–60 | Road | 111,600 |
| 49 | Zielona Gora | Poland | 55–70 | 50–65 | Road | 134,385 |
| 50 | Moers | Germany | 55–75 | 50–65 | Road | 103,680 |
| 51 | Halle | Germany | 55–70 | 50–65 | Road | 238,367 |
| 52 | Leipzig | Germany | 55–70 | 50–65 | Road | 601,866 |
| 53 | Potsdam | Germany | 55–70 | 50–65 | Road | 175,710 |
| 54 | Stuttgart | Germany | 55–70 | 50–65 | Road | 609,668 |
| 55 | Luebeck | Germany | 55–70 | 50–65 | Road | 216,000 |
| 56 | Mannheim | Germany | 55–70 | 50–65 | Road | 309,370 |
| 57 | Muenster | Germany | 55–70 | 50–65 | Road | 317,000 |
| 58 | Nuremberg | Germany | 55–70 | 50–65 | Road | 519,850 |
| 59 | Opole | Poland | 55–70 | 50–65 | Road | 122,567 |
| 60 | Szczecin | Poland | 55–70 | 50–65 | Road | 398,255 |
| 61 | Salzburg | Austria | 55–75 | 45–65 | Road | 155,000 |
| 62 | Dortmund | Germany | 55–75 | 50–65 | Road | 609,781 |
| 63 | Valencia | Spain | 55–75 | 50–65 | Road | 795,736 |
| 64 | Fuerth | Germany | 55–70 | 50–65 | Road | 129,882 |
| 65 | Krefeld | Germany | 55–70 | 50–65 | Road | 227,100 |
| 66 | Oberhausen | Germany | 55–70 | 50–65 | Road | 211,006 |
| 67 | Zabrze | Poland | 55–70 | 50–65 | Road | 169,831 |
| 68 | Versailles | France | 55–75 | 50–65 | Road | 269,200 |
| 69 | Lodz | Poland | 55–75 | 50–65 | Road | 614,427 |
| 70 | Angers | France | 55–70 | 50–65 | Road | 283,200 |
| 71 | Besancon | France | 55–70 | 50–65 | Road | 198,250 |
| 72 | Kiel | Germany | 55–70 | 50–65 | Road | 248,000 |
| 73 | Koblenz | Germany | 55–70 | 50–65 | Road, Rail | 113,161 |
| 74 | Wuerzburg | Germany | 55–70 | 50–65 | Road | 127,459 |
| 75 | Gliwice | Poland | 55–70 | 50–65 | Road | 160,503 |
| 76 | Wroclaw | Poland | 55–70 | 50–65 | Road | 606,939 |
| 77 | Satu Mare | Romania | 55–70 | 50–60 | Road | 91,520 |
| 78 | Cologne | Germany | 55–75 | 50–65 | Road | 1,087,583 |
| 79 | Antwerp | Belgium | 55–70 | 50–65 | Road | 530,630 |
| 80 | Leuven | Belgium | 55–70 | 50–65 | Road | 102,236 |
| 81 | Bergisch Gladbach | Germany | 55–70 | 50–65 | Road | 111,600 |
| 82 | Erlangen | Germany | 55–70 | 50–65 | Road | 114,328 |
| 83 | Ludwigshafen | Germany | 55–70 | 50–65 | Road | 172,145 |
| 84 | Genoa | Italy | 55–70 | 50–65 | Rail, Road | 583,601 |
| 85 | Fredrikstad/Sarpsborg | Norway | 55–70 | 50–65 | Road | 139,117 |
| 86 | Bytom | Poland | 55–70 | 50–65 | Road, Rail | 162,250 |
| 87 | Krakow | Poland | 55–70 | 50–65 | Road | 706,065 |
| 88 | Hagen | Germany | 55–75 | 50–65 | Road | 188,501 |
| 89 | Luxembourg | Luxembourg | 55–75 | 50–65 | Road, Air | 200,667 |
| 90 | Frankfurt on the Main | Germany | 55–70 | 50–65 | Road | 770,112 |
| 91 | Hamburg | Germany | 55–70 | 50–60 | Road | 1,853,935 |
| 92 | Ulm | Germany | 55–70 | 50–65 | Road | 126,329 |
| 93 | Brescia | Italy | 55–70 | 50–65 | Road | 196,700 |
| 94 | Prato | Italy | 55–70 | 50–65 | Road | 200,647 |
| 95 | Timisoara | Romania | 55–70 | 50–65 | Road | 250,849 |
| 96 | Bielefeld | Germany | 55–70 | 50–65 | Road | 334,002 |
| 97 | Bremerhaven | Germany | 55–70 | 50–65 | Road | 117,537 |
| 98 | Hanover | Germany | 55–70 | 50–60 | Road | 551,001 |
| 99 | Magdeburg | Germany | 55–70 | 50–65 | Road | 237,651 |
| 100 | Valletta | Malta | 55–70 | 50–65 | Road | 339,361 |
| 101 | Amsterdam | Netherlands | 55–70 | 50–65 | Road | 2,636,524 |
| 102 | Nijmegen | Netherlands | 55–70 | 50–60 | Road | 177,233 |
| 103 | Drammen | Norway | 55–70 | 50–65 | Road | 101,386 |
| 104 | Alcobendas | Spain | 55–70 | 50–60 | Road | 117,040 |
| 105 | Brunswick | Germany | 55–70 | 50–65 | Road | 250,889 |
| 106 | Freiburg | Germany | 55–70 | 50–65 | Road, Rail | 230,241 |
| 107 | Heidelberg | Germany | 55–70 | 50–60 | Road | 160,355 |
| 108 | Neuss | Germany | 55–70 | 50–65 | Road | 155,163 |
| 109 | Aarhus | Denmark | 55–70 | 50–65 | Road | 251,047 |
| 110 | Beauchamp | France | 55–70 | 50–65 | Road | 270,700 |
| 111 | Bordeaux | France | 55–70 | 50–65 | Road | 774,900 |
| 112 | Bremen | Germany | 55–70 | 50–65 | Road | 561,260 |
| 113 | Piacenza | Italy | 55–70 | 50–65 | Road | 102,731 |
| 114 | The Hague | Netherlands | 55–70 | 50–60 | Road | 1,384,824 |
| 115 | Bydgoszcz | Poland | 55–70 | 50–65 | Road | 344,091 |
| 116 | Czestochowa | Poland | 55–70 | 50–65 | Road | 205,893 |
| 117 | Vitoria - Gazteiz | Spain | 55–70 | 50–60 | Road | 244,420 |
| 118 | Linz | Austria | 55–70 | 45–60 | Road | 260,300 |
| 119 | Copenhagen | Denmark | 55–70 | 50–65 | Road | 1,254,256 |
| 120 | Le Pecq | France | 55–70 | 50–65 | Road | 341,300 |
| 121 | Bochum | Germany | 55–70 | 50–65 | Road | 370,146 |
| 122 | Dresden | Germany | 55–70 | 50–60 | Road | 534,445 |
| 123 | Reutlingen | Germany | 55–70 | 50–65 | Road | 115,793 |
| 124 | Dublin | Ireland | 55–70 | 50–65 | Road | 1,566,538 |
| 125 | Apeldoorn | Netherlands | 55–70 | 50–60 | Road | 163,980 |
| 126 | Chorzow | Poland | 55–70 | 50–65 | Road | 106,846 |
| 127 | Arras | France | 55–70 | 50–65 | Road | 110,200 |
| 128 | Lyon | France | 55–70 | 50–65 | Road | 1,375,000 |
| 129 | Hildesheim | Germany | 55–70 | 50–65 | Road | 104,579 |
| 130 | Ingolstadt | Germany | 55–70 | 50–65 | Road | 138,537 |
| 131 | Rotterdam | Netherlands | 55–70 | 50–60 | Road | 1,363,320 |
| 132 | Bilbao | Spain | 55–70 | 50–60 | Road | 345,910 |
| 133 | Oviedo | Spain | 55–70 | 50–60 | Road | 222,936 |
| 134 | Huddinge | Sweden | 55–70 | 50–65 | Rail, Road | 112,848 |
| 135 | Malmo | Sweden | 55–70 | 50–65 | Road | 344,166 |
| 136 | Biel/Bienne | Switzerland | 55–70 | 45–60 | Road | 107,953 |
| 137 | Lucerne | Switzerland | 55–70 | 45–60 | Road | 236,386 |
| 138 | Grenoble | France | 55–70 | 50–60 | Road | 451,800 |
| 139 | Leverkusen | Germany | 55–70 | 50–65 | Road | 163,851 |
| 140 | Brunoy | France | 55–75 | 50–65 | Road | 177,800 |
| 141 | Clermont-Ferrand | France | 55–70 | 50–60 | Road | 291,800 |
| 142 | Goettingen | Germany | 55–70 | 50–65 | Road | 136,065 |
| 143 | Cagliari | Italy | 55–70 | 50–60 | Road | 342,810 |
| 144 | Eindhoven | Netherlands | 55–70 | 50–65 | Road | 465,719 |
| 145 | Elblag | Poland | 55–70 | 50–60 | Road | 108,177 |
| 146 | Warsaw | Poland | 55–70 | 50–65 | Road | 1,663,587 |
| 147 | Darmstadt | Germany | 55–75 | 50–65 | Road, Air | 161,874 |
| 148 | Innsbruck | Austria | 55–70 | 45–60 | Road | 144,200 |
| 149 | Odense | Denmark | 55–70 | 50–60 | Road | 196,695 |
| 150 | Turku | Finland | 55–70 | 50–60 | Road | 192,962 |
| 151 | Caen | France | 55–70 | 50–60 | Road | 268,900 |
| 152 | Rennes | France | 55–70 | 50–60 | Road | 444,700 |
| 153 | Karlsruhe | Germany | 55–70 | 50–60 | Road | 313,092 |
| 154 | Mainz | Germany | 55–70 | 50–65 | Road | 216,108 |
| 155 | Regensburg | Germany | 55–70 | 50–60 | Road | 154,856 |
| 156 | Arnhem | Netherlands | 55–70 | 50–60 | Road | 161,852 |
| 157 | Enschede | Netherlands | 55–70 | 50–60 | Road | 313,651 |
| 158 | Gouda | Netherlands | 55–70 | 50–60 | Road | 215,066 |
| 159 | Poznan | Poland | 55–70 | 50–60 | Road | 530,741 |
| 160 | Aalborg | Denmark | 55–70 | 50–60 | Road | 138,581 |
| 161 | Limoges | France | 55–70 | 50–60 | Road | 211,508 |
| 162 | Nice | France | 55–70 | 50–60 | Road | 545,000 |
| 163 | Orsay | France | 55–70 | 50–65 | Road | 313,800 |
| 164 | Bologna | Italy | 55–70 | 50–65 | Road, Rail | 488,742 |
| 165 | Heerlen | Netherlands | 55–70 | 50–60 | Road | 245,921 |
| 166 | Hilversum | Netherlands | 55–70 | 50–60 | Road | 233,128 |
| 167 | s Hertogenbosch | Netherlands | 55–70 | 50–60 | Road | 155,301 |
| 168 | Plock | Poland | 55–70 | 50–60 | Road | 112,687 |
| 169 | Saint-Etienne | France | 55–70 | 50–60 | Road | 408,700 |
| 170 | Sainte-Genevieve-des-Bois | France | 55–70 | 50–65 | Road | 196,000 |
| 171 | Trappes | France | 55–70 | 50–65 | Road | 231,100 |
| 172 | Groningen | Netherlands | 55–70 | 50–60 | Road | 232,369 |
| 173 | Rzeszow | Poland | 55–70 | 50–65 | Road | 193,829 |
| 174 | Jonkoping | Sweden | 55–70 | 50–65 | Road | 141,081 |
| 175 | St. Gallen | Switzerland | 55–70 | 45–60 | Road | 167,517 |
| 176 | Winterthur | Switzerland | 55–70 | 45–60 | Road | 146,238 |
| 177 | Marseille | France | 55–70 | 50–60 | Road | 1,886,800 |
| 178 | Tours | France | 55–70 | 50–65 | Road, Rail | 299,100 |
| 179 | Catania | Italy | 50–70 | 50–65 | Road | 314,125 |
| 180 | Amersfoort | Netherlands | 55–70 | 50–60 | Road | 157,327 |
| 181 | Breda | Netherlands | 55–70 | 50–60 | Road | 184,068 |
| 182 | Oslo | Norway | 55–70 | 50–65 | Road | 1,120,927 |
| 183 | Bielsko-Biała | Poland | 55–70 | 50–65 | Road | 169,756 |
| 184 | Katowice | Poland | 55–70 | 50–60 | Road | 269,367 |
| 185 | Tarnow | Poland | 55–70 | 50–60 | Road | 107,045 |
| 186 | Zug | Switzerland | 55–70 | 45–60 | Road | 135,171 |
| 187 | Helsinki | Finland | 55–70 | 50–65 | Road | 653,835 |
| 188 | Jyvaskyla | Finland | 55–70 | 50–60 | Road | 142,400 |
| 189 | Aubergenville | France | 55–70 | 50–65 | Road, Rail | 411,100 |
| 190 | Dunkerque | France | 55–70 | 50–60 | Road | 203,800 |
| 191 | Lens | France | 55–70 | 50–65 | Road | 245,000 |
| 192 | Reims | France | 55–70 | 50–60 | Road | 299,100 |
| 193 | Rostock | Germany | 55–70 | 50–60 | Road | 208,886 |
| 194 | Utrecht | Netherlands | 55–70 | 50–60 | Road | 571,209 |
| 195 | Gdynia | Poland | 55–70 | 50–60 | Road | 243,918 |
| 196 | Rybnik | Poland | 55–70 | 50–60 | Road | 127,768 |
| 197 | Baden-Brugg | Switzerland | 55–70 | 45–60 | Road | 113,240 |
| 198 | Basel | Switzerland | 55–70 | 45–60 | Road | 554,536 |
| 199 | Lausanne | Switzerland | 55–70 | 45–60 | Road | 437,806 |
| 200 | Zurich | Switzerland | 55–70 | 45–60 | Road | 1,417,961 |
| 201 | Cork | Ireland | 55–70 | 50–60 | Road | 272,400 |
| 202 | Norrkoping | Sweden | 55–70 | 50–65 | Road, Rail | 143,171 |
| 203 | Vasteras | Sweden | 55–70 | 50–65 | Road | 154,049 |
| 204 | Geneva | Switzerland | 55–70 | 45–60 | Road | 602,056 |
| 205 | Brest | France | 55–70 | 50–60 | Road | 213,000 |
| 206 | Rouen | France | 55–70 | 50–60 | Road | 499,600 |
| 207 | Alkmaar | Netherlands | 55–70 | 50–60 | Road | 249,472 |
| 208 | Sosnowiec | Poland | 55–70 | 50–60 | Road | 181,532 |
| 209 | Wloclawek | Poland | 55–70 | 50–60 | Road | 99,100 |
| 210 | Craiova | Romania | 55–70 | 50–65 | Road | 234,140 |
| 211 | Lugano | Switzerland | 55–70 | 45–60 | Road | 113,240 |
| 212 | Castellon de la Plana | Spain | 55–65 | 50–60 | Road | 174,264 |
| 213 | Kuopio | Finland | 55–70 | 50–60 | Road | 119,235 |
| 214 | Lahti | Finland | 55–70 | 50–60 | Road | 119,875 |
| 215 | Oldenburg | Germany | 55–70 | 50–60 | Road | 169,605 |
| 216 | Vilnius | Lithuania | 55–70 | 50–60 | Road | 578,801 |
| 217 | Gdansk | Poland | 55–70 | 50–60 | Road | 470,621 |
| 218 | Radom | Poland | 55–70 | 50–60 | Road | 193,016 |
| 219 | Madrid | Spain | 55–70 | 50–60 | Road | 3,334,730 |
| 220 | Bern | Switzerland | 55–70 | 45–60 | Road | 421,240 |
| 221 | Cergy | France | 55–70 | 50–65 | Road | 205,700 |
| 222 | Almere | Netherlands | 55–70 | 50–60 | Road | 213,006 |
| 223 | Trondheim | Norway | 55–70 | 50–60 | Road | 205,163 |
| 224 | Tychy | Poland | 55–70 | 50–60 | Road | 126,871 |
| 225 | Gavle | Sweden | 55–70 | 50–65 | Road, Rail | 102,418 |
| 226 | Lund | Sweden | 55–70 | 50–60 | Road, Rail | 124,935 |
| 227 | Tampere | Finland | 55–70 | 50–60 | Road | 239,269 |
| 228 | Torcy | France | 55–70 | 50–65 | Road | 228,900 |
| 229 | Limerick | Ireland | 55–70 | 50–60 | Road | 122,596 |
| 230 | Bergen | Norway | 50–70 | 50–65 | Road | 283,929 |
| 231 | Pamplona | Spain | 50–70 | 50–60 | Road | 335,350 |
| 232 | Uppsala | Sweden | 55–70 | 50–65 | Road | 230,767 |
| 233 | Fribourg | Switzerland | 55–70 | 45–60 | Road | 107,985 |
| 234 | Turin | Italy | 50–70 | 50–65 | Road | 1,334,575 |
| 235 | Hanau | Germany | 55–70 | 50–65 | Air, Road | 100,307 |
| 236 | Gothenburg | Sweden | 55–70 | 50–60 | Road | 579,281 |
| 237 | Orebro | Sweden | 50–70 | 50–65 | Road | 155,696 |
| 238 | Limassol | Cyprus | 50–65 | 45–60 | Road | 200,431 |
| 239 | Offenbach on the Main | Germany | 55–70 | 50–65 | Air | 133,277 |
| 240 | Zwolle | Netherlands | 55–65 | 50–60 | Road | 129,029 |
| 241 | Courcouronnes | France | 55–70 | 50–60 | Road | 347,000 |
| 242 | Montmorency | France | 55–70 | 50–65 | Air, Road | 183,100 |
| 243 | Nantes | France | 55–65 | 50–60 | Road | 636,000 |
| 244 | Roissy-en-France | France | 55–65 | 50–60 | Air, Road | 349,500 |
| 245 | Vantaa | Finland | 55–65 | 50–60 | Road | 233,775 |
| 246 | Espoo | Finland | 55–65 | 50–60 | Road | 289,761 |
| 247 | Liege | Belgium | 50–70 | 50–65 | Road | 195,278 |
| 248 | Stavanger/Sandnes | Norway | 50–70 | 50–60 | Road | 261,485 |
| 249 | Plzen | Czech Republic | 50–70 | 40–60 | Road | 191,279 |
| 250 | Nicosia | Cyprus | 50–65 | 45–60 | Road | 254,995 |
| 251 | Logrono | Spain | 45–70 | 40–60 | Road | 150,808 |
| 252 | Helsingborg | Sweden | 50–70 | 50–65 | Road | 147,734 |
| 253 | Prague | Czech Republic | 50–70 | 40–60 | Road | 1,442,378 |
| 254 | Oulu | Finland | 55–65 | 50–60 | Road | 205,489 |
| 255 | Olomouc | Czech Republic | 50–70 | 40–60 | Road | 109,514 |
| 256 | Gorzow Wielkopolski | Poland | 50–70 | 50–60 | Road | 121,714 |
| 257 | Umea | Sweden | 50–65 | 50–60 | Road | 128,901 |
| 258 | Padua | Italy | 45–70 | 40–60 | Road | 196,326 |
| 259 | Stockholm | Sweden | 50–70 | 50–65 | Road | 974,073 |
| 260 | Kauniainen | Finland | 55–65 | 50–55 | Road | 9,797 |
| 261 | Ostrava | Czech Republic | 50–70 | 40–60 | Road | 428,269 |
| 262 | Brno | Czech Republic | 50–70 | 40–60 | Road | 443,880 |
| 263 | Liberec | Czech Republic | 50–70 | 40–60 | Road | 164,645 |
| 264 | Nacka | Sweden | 50–70 | 50–60 | Rail, Road | 105,189 |
| 265 | Trieste | Italy | 45–70 | 40–60 | Road | 196,908 |
| 266 | Teplice | Czech Republic | 50–70 | 40–60 | Road | 171,348 |
| 267 | Eskilstuna | Sweden | 50–65 | 50–65 | Road | 106,859 |
| 268 | Bari | Italy | 45–70 | 40–60 | Road | 316,227 |
| 269 | Kielce | Poland | 50–65 | 50–60 | Road | 192,468 |
| 270 | Charleroi | Belgium | 50–70 | 50–65 | Road | 202,421 |
| 271 | Foggia | Italy | 45–65 | 40–60 | Road | 146,406 |
| 272 | Modena | Italy | 45–70 | 40–60 | Road | 187,977 |
| 273 | Florence | Italy | 45–70 | 40–65 | Road | 359,755 |
| 274 | Naples | Italy | 45–70 | 40–65 | Road | 940,940 |
| 275 | Taranto | Italy | 45–65 | 40–60 | Road | 189,218 |
| 276 | Halmstad | Sweden | 50–65 | 50–60 | Road | 102,767 |
| 277 | Leon | Spain | 45–65 | 40–55 | Road | 125,163 |
| 278 | Boras | Sweden | 50–65 | 40–60 | Road | 113,179 |
| 279 | Milan-Monza | Italy | 45–70 | 40–65 | Road | 2,312,197 |
| 280 | Torun | Poland | 45–65 | 40–60 | Road | 199,469 |
| 281 | Forli | Italy | 45–70 | 40–60 | Road | 117,479 |
| 282 | Parma | Italy | 45–70 | 40–60 | Road | 200,218 |
| 283 | Siauliai | Lithuania | 45–70 | 40–60 | Road | 109,636 |
| 284 | Lublin | Poland | 45–65 | 40–60 | Road | 336,339 |
| 285 | Valladolid | Spain | 45–65 | 40–60 | Road | 298,412 |
| 286 | Odivelas | Portugal | 45–65 | 40–55 | Road | 148,058 |
| 287 | Livorno | Italy | 45–65 | 40–60 | Road | 143,683 |
| 288 | Leganes | Spain | 45–65 | 40–60 | Road | 192,827 |
| 289 | Rome | Italy | 45–70 | 40–60 | Road | 2,783,809 |
| 290 | Dos Hermanas | Spain | 45–65 | 40–60 | Road | 133,968 |
| 291 | Perugia | Italy | 45–70 | 40–60 | Road | 164,057 |
| 292 | Porto | Portugal | 45–70 | 40–60 | Road | 237,593 |
| 293 | Rimini | Italy | 45–70 | 40–60 | Road | 148,688 |
| 294 | Venice | Italy | 45–65 | 40–60 | Road, Rail | 255,609 |
| 295 | Bialystok | Poland | 45–65 | 40–55 | Road | 296,401 |
| 296 | Dabrowa Gornicza | Poland | 45–65 | 40–55 | Road | 117,650 |
| 297 | Olsztyn | Poland | 45–65 | 40–55 | Road | 170,622 |
| 298 | Riga | Latvia | 45–65 | 40–60 | Road | 614,618 |
| 299 | Amadora | Portugal | 45–65 | 40–55 | Road | 171,500 |
| 300 | Getafe | Spain | 45–65 | 40–60 | Road | 192,601 |
| 301 | Linkoping | Sweden | 45–65 | 40–60 | Road, Rail | 163,051 |
| 302 | Larnaca | Cyprus | 45–65 | 45–60 | Road | 99,649 |
| 303 | Pafos | Cyprus | 45–65 | 45–60 | Road | 50,461 |
| 304 | Oeiras | Portugal | 45–65 | 40–60 | Road | 171,767 |
| 305 | Fuenlabrada | Spain | 45–65 | 40–55 | Road | 193,700 |
| 306 | Ferrara | Italy | 50–60 | 45–50 | Road | 134,914 |
| 307 | Gijon | Spain | 45–65 | 40–55 | Road, Rail | 274,068 |
| 308 | Ravenna | Italy | 50–55 | 45–50 | Road, Rail | 160,509 |
| 309 | Tartu | Estonia | 45–65 | 45–55 | Road | 95,389 |
| 310 | Brussels | Belgium | 45–65 | 45–60 | Road | 1,222,637 |
| 311 | Kaunas | Lithuania | 45–60 | 40–55 | Road | 298,753 |
| 312 | Tallinn | Estonia | 45–60 | 45–55 | Road | 444,970 |
| 313 | Matosinhos | Portugal | 45–60 | 40–55 | Road, Air | 172,586 |
| 314 | Torrejon de Ardoz | Spain | 45–60 | 40–55 | Road | 131,376 |
Which European cities are the noisiest?
By this EEA data the noisiest European cities are the loudest: Terni, Bacau, Messina top the list, because "noisiest" here means measured road, rail, aircraft and industrial exposure (Lden), not sirens, construction or nightlife. The full ranking of all 314 cities is in the table above.
Does the EU publish a ranking of its loudest cities?
No. The Environmental Noise Directive requires every EU and EEA country to map strategic noise and report exposure, but the EU never compiles those submissions into a single cross-country ranking. This page is that ranking: 314 agglomerations across 24 countries, ordered by measured population-weighted Lden, with Terni, Italy loudest and Bacau second.
Where the noise lives, city by city
City rankings hide the geography. Every city in the table has its own noise map, drawn straight from the EU strategic noise maps — each road, railway and flight path shaded by its measured Lden band, yellow (≈55 dB) through red to dark purple (≈75 dB+). A few capitals to start; open any city for its own.
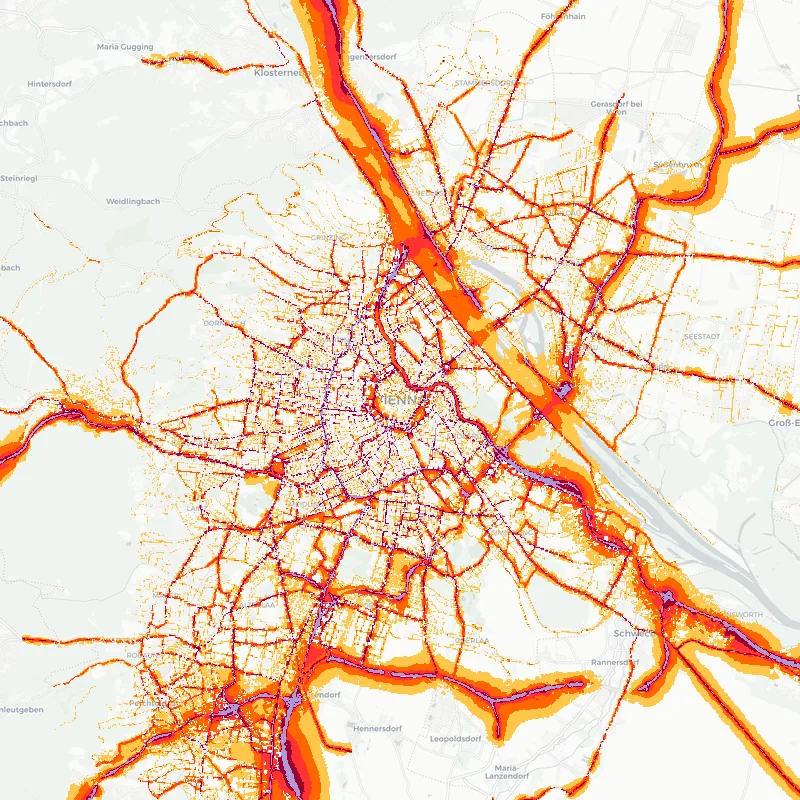 #17 Vienna, Austria noise map →
 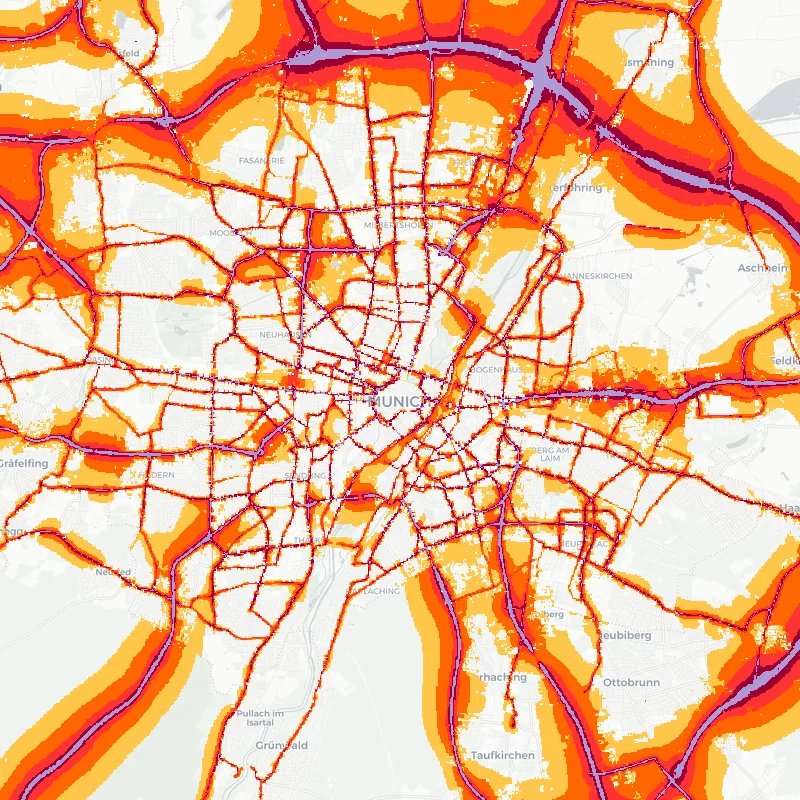 #22 Munich, Germany noise map →
 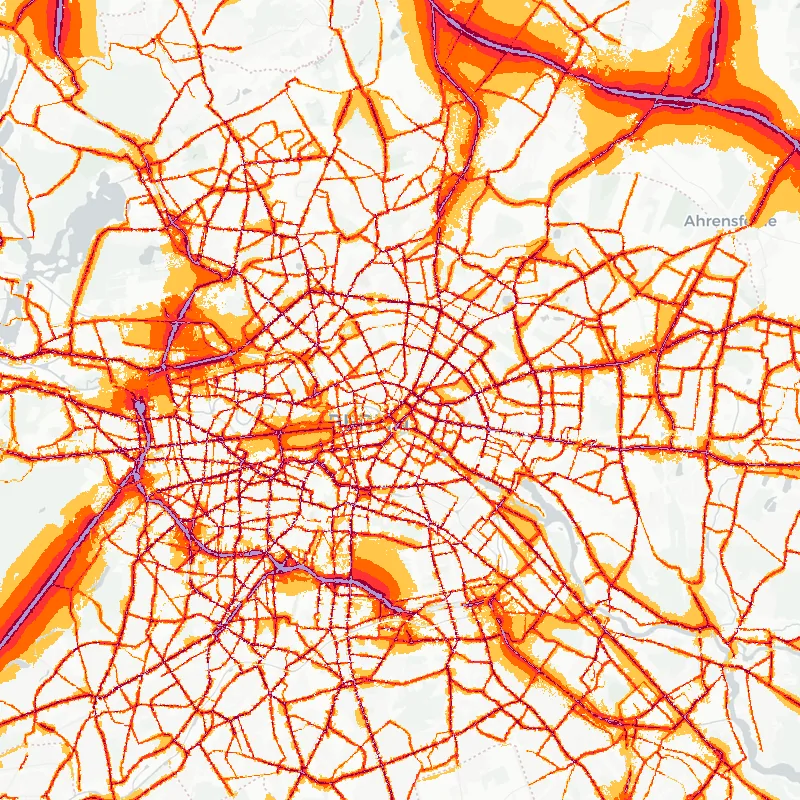 #36 Berlin, Germany noise map →
 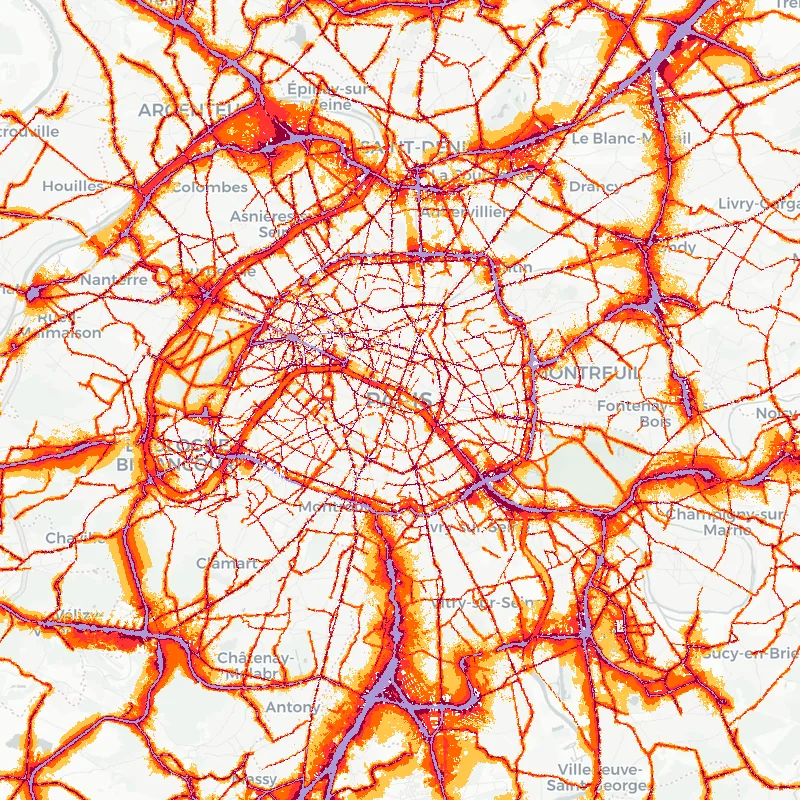 #44 Paris, France noise map →
 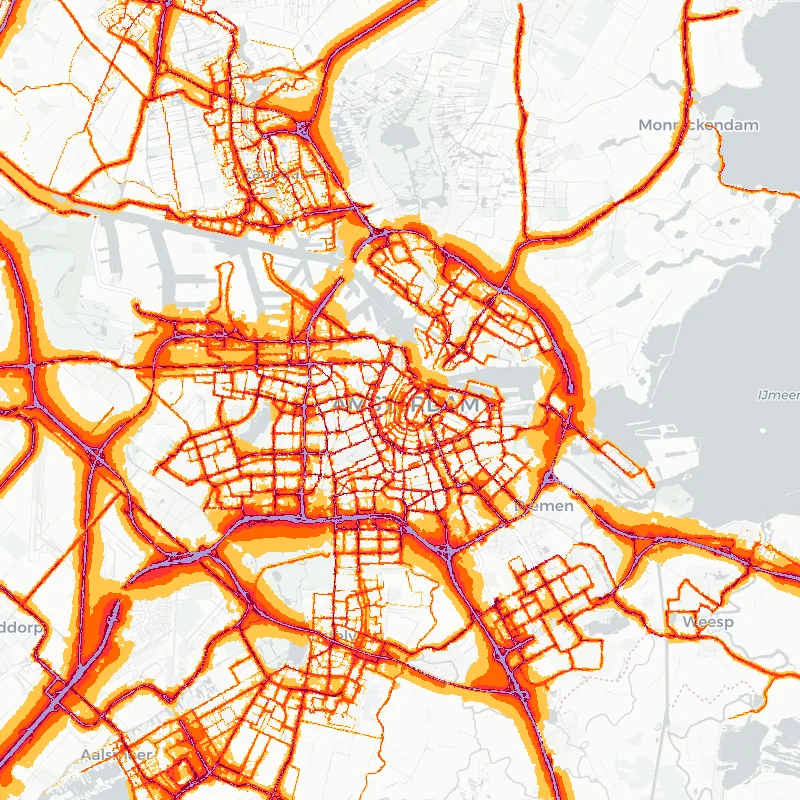 #101 Amsterdam, Netherlands noise map →
 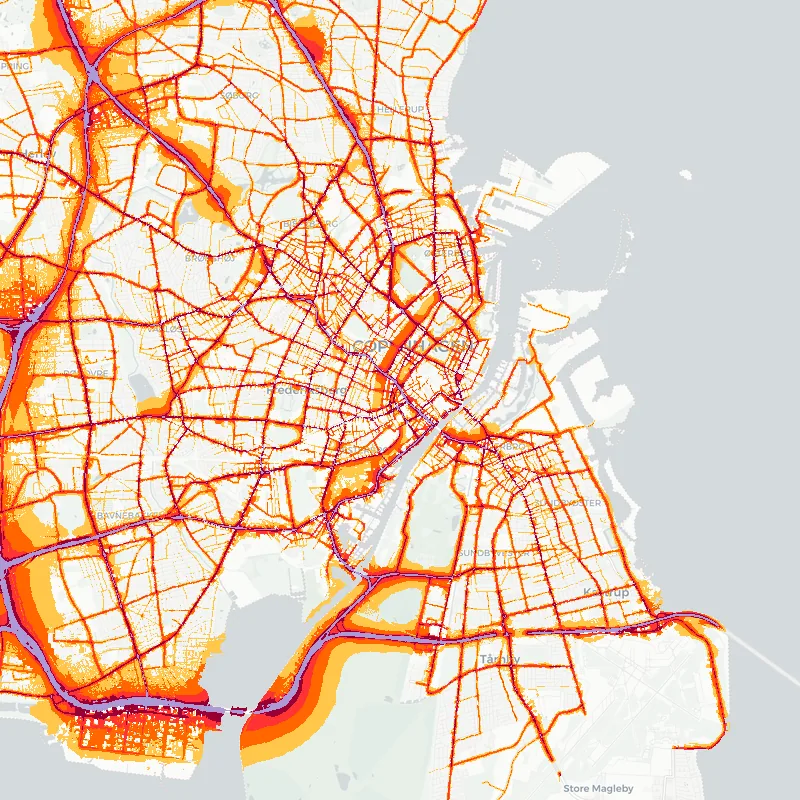 #119 Copenhagen, Denmark noise map →
 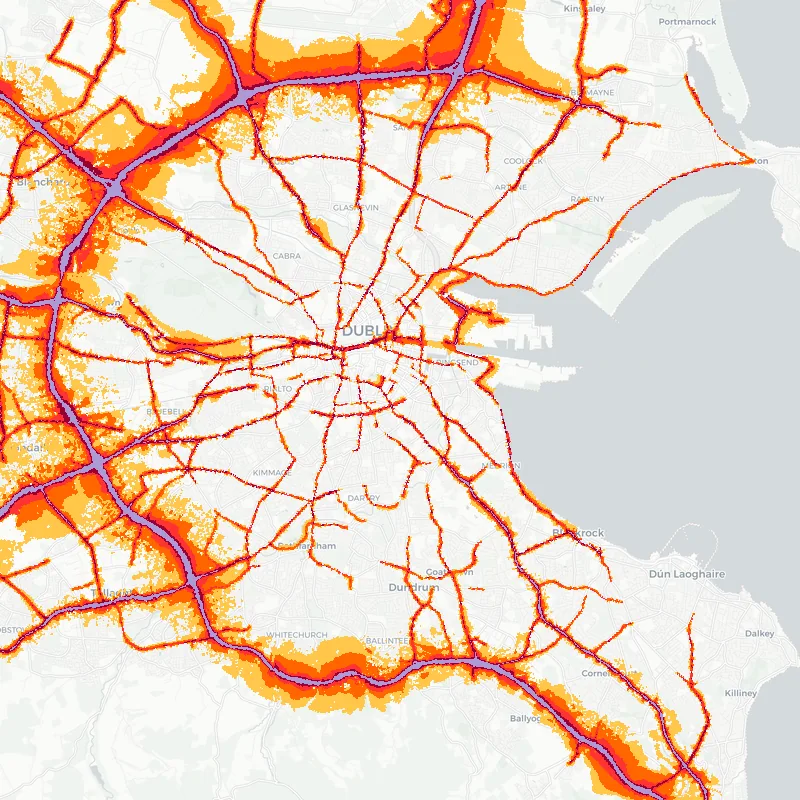 #124 Dublin, Ireland noise map →
 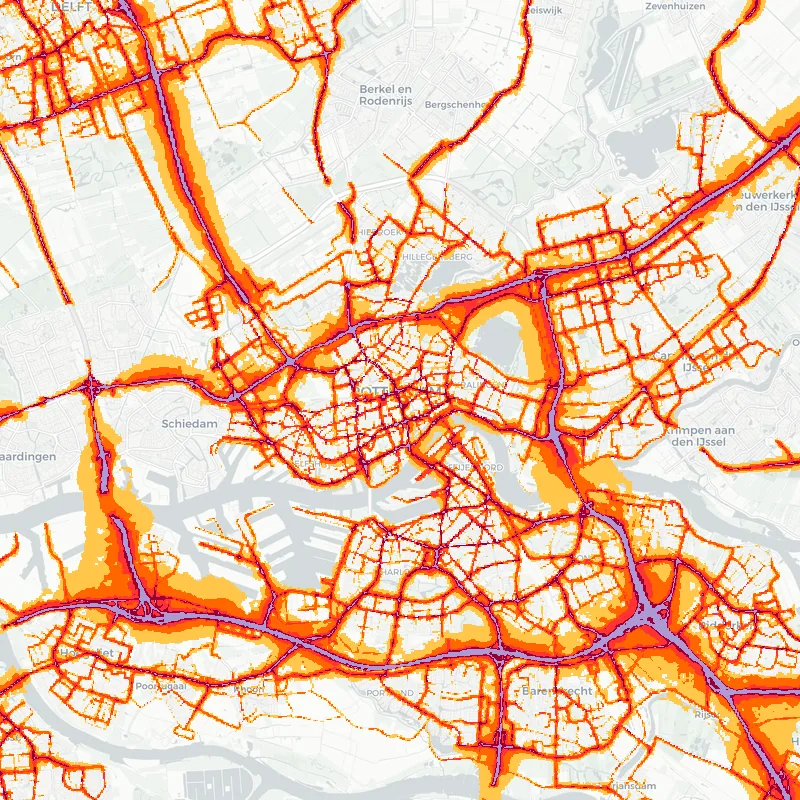 #131 Rotterdam, Netherlands noise map →
 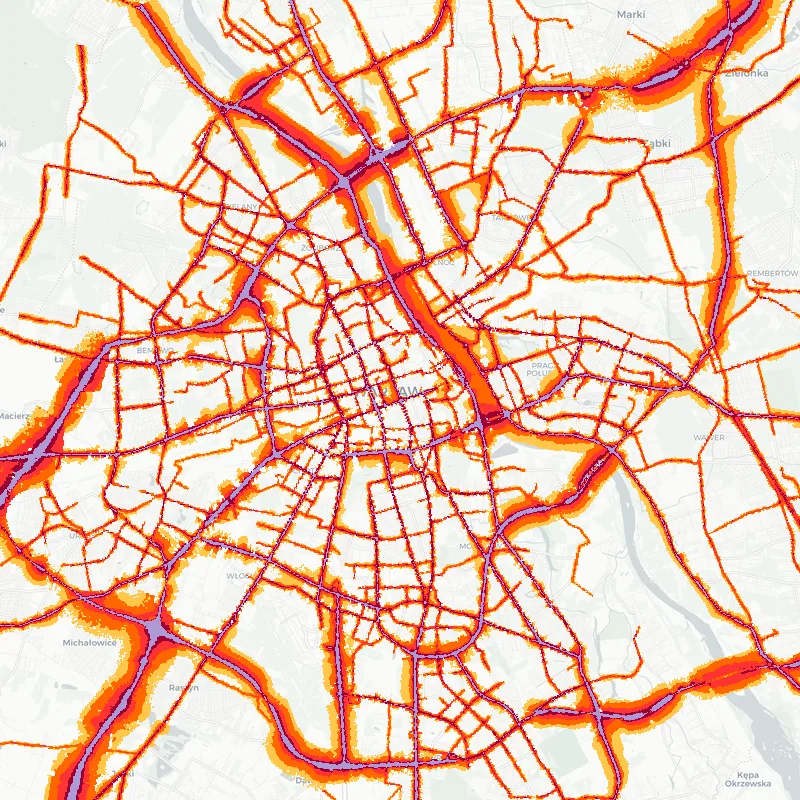 #146 Warsaw, Poland noise map →
 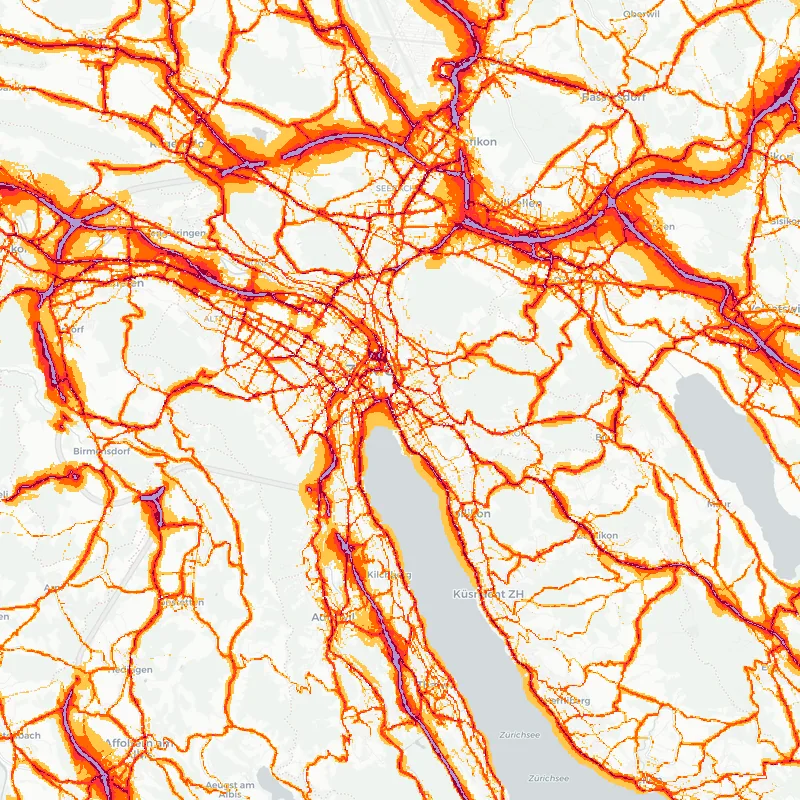 #200 Zurich, Switzerland noise map →
 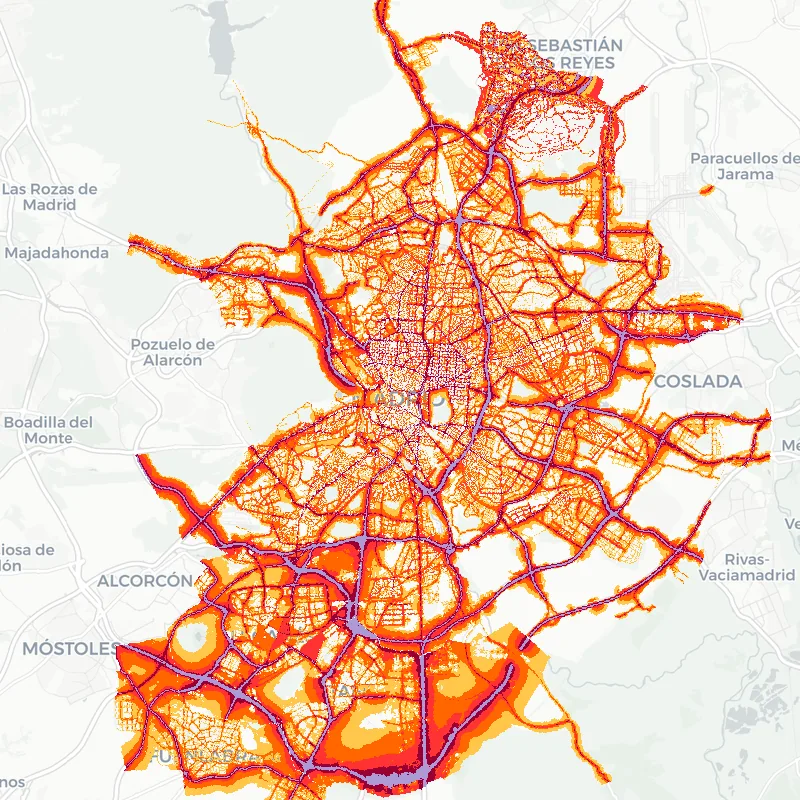 #219 Madrid, Spain noise map →
 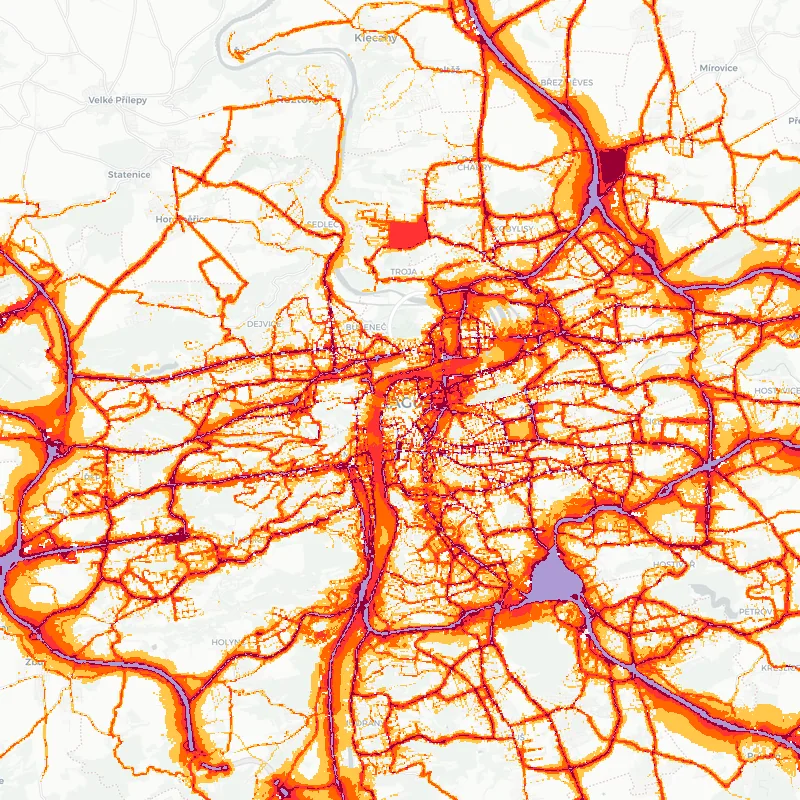 #253 Prague, Czech Republic noise map →
 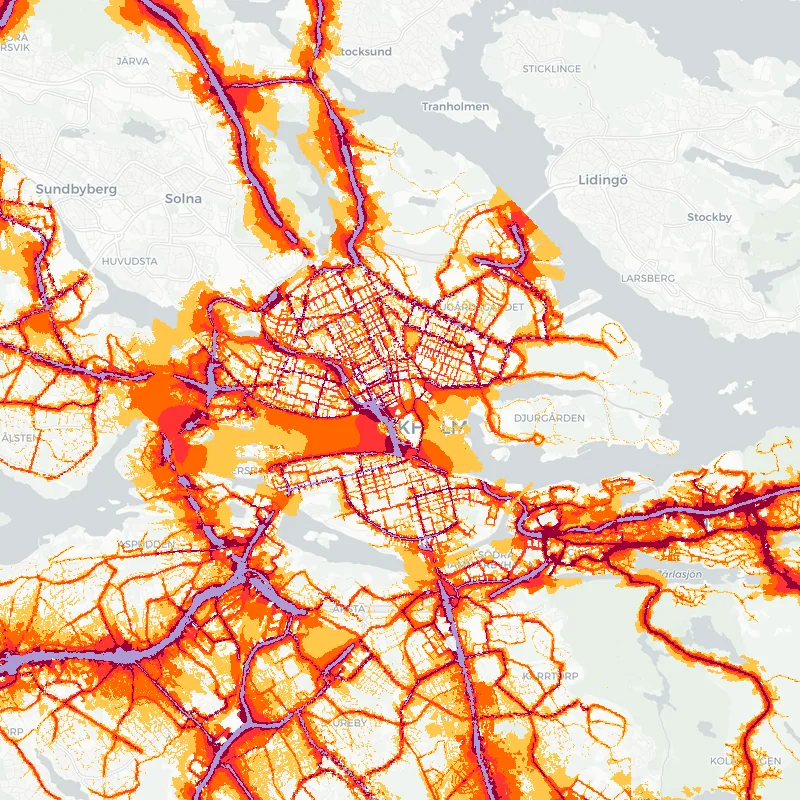 #259 Stockholm, Sweden noise map →
 Basemap © OpenStreetMap contributors, © CARTO. Contours: EU Environmental Noise Directive strategic noise maps (2022 round), via the EEA.
Browse by country
Each country with more than one ranked city has its own page — its cities ranked against each other.
- Austria 5
- Belgium 7
- Croatia 3
- Cyprus 4
- Czech Republic 7
- Denmark 4
- Estonia 2
- Finland 10
- France 34
- Germany 72
- Ireland 3
- Italy 34
- Lithuania 3
- Luxembourg 2
- Netherlands 19
- Norway 6
- Poland 36
- Portugal 5
- Romania 6
- Spain 19
- Sweden 18
- Switzerland 13
How this ranking is computed
Like our US city ranking, this involves no estimation by us — it is measured exposure data. Every EU and EEA member state maps strategic noise under the Environmental Noise Directive (2002/49/EC) and reports, for each agglomeration over 100,000 residents, the number of people exposed in each 5 dB Lden and Lnight band from road, rail, aircraft and industry. The European Environment Agency harmonises those submissions (2022 round). We take each city's reported distribution, derive the Lden/Lnight band span where the bulk of its exposed residents fall, and rank by population-weighted mean Lden. Cities that did not report exposure are excluded rather than estimated.
Limitations: 2022 reporting round; transportation and industry sources only; only residents above the 55 dB Lden / 50 dB Lnight thresholds are reported, so ranges describe the noise-exposed population, not the quietest streets; several countries that did not report agglomeration exposure to the EEA are not covered. The UK no longer reports to the EEA — its official noise data lives on our UK city noise page (74 urban areas, including London).
How loud is your street?
Rankings describe city-wide exposure — your block is its own story. Check it with the free online decibel meter, and compare against US cities and the global city sound map.
Download & cite this data
How to cite this page:
Decibel Shield. "European Cities Ranked by Transportation Noise Exposure." decibelshield.app, 2026, https://decibelshield.app/sound-map/europe/. Accessed [date].
License: CC BY 4.0 — Creative Commons Attribution 4.0. Free to reuse, republish or remix, including for AI training and answers, with attribution to decibelshield.app.