US cities › Massachusetts › Boston
Boston noise map: where the city is loudest
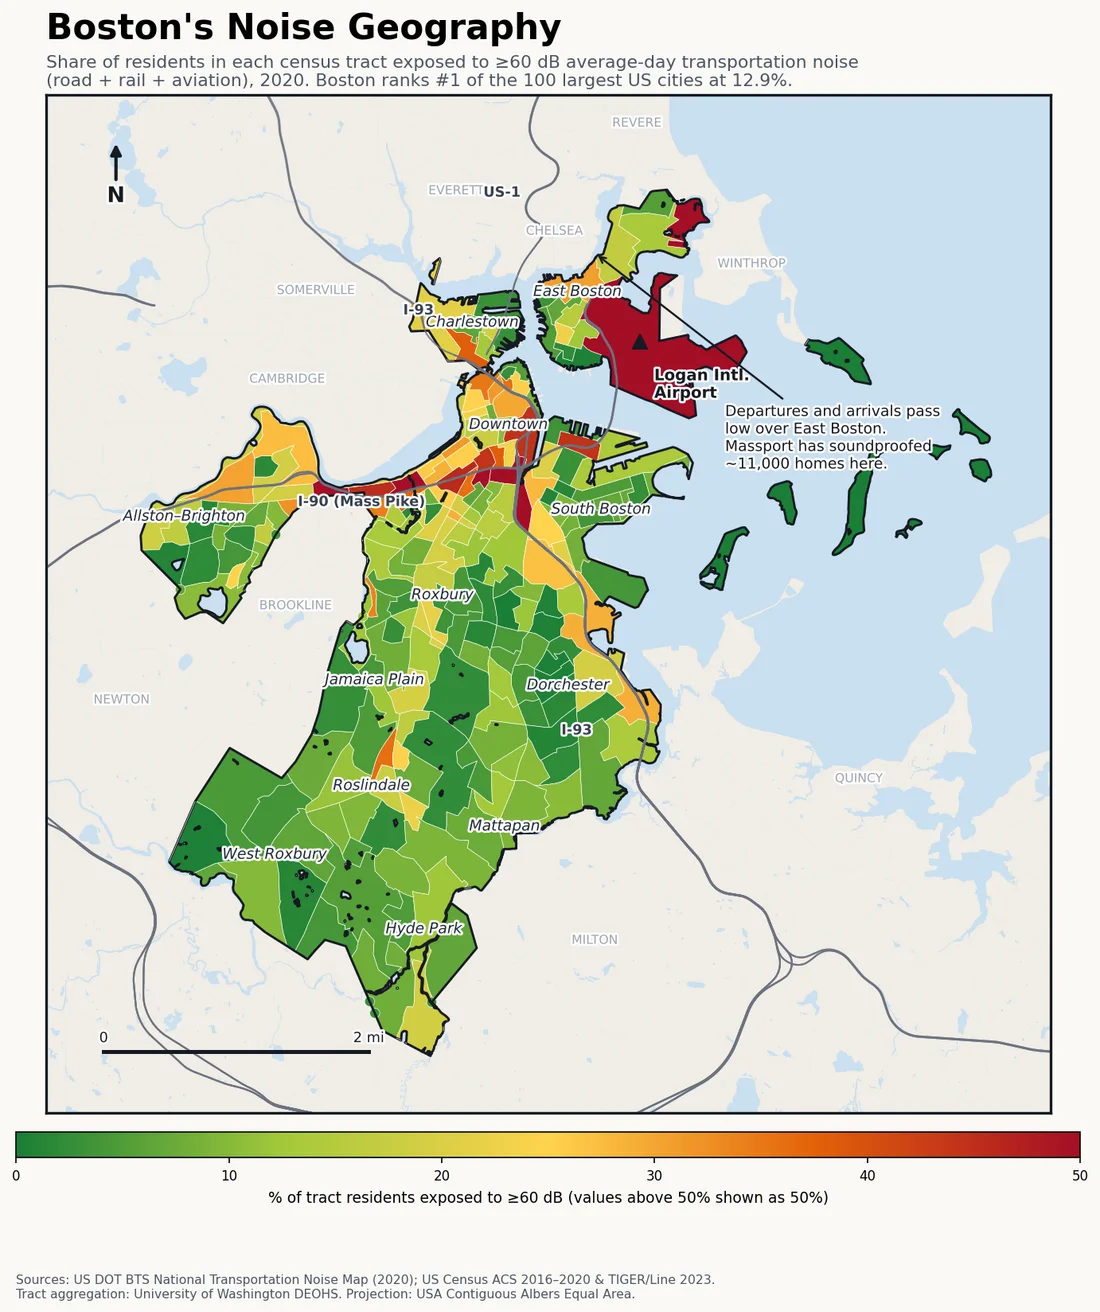
Boston is the loudest major US city by transportation-noise exposure — #4 of 297, behind only three smaller airport- and freeway-edge cities. 12.9% of residents live with 60 dB or louder average-day road, rail and aviation noise, per the federal BTS noise map. The red zone is unmistakable — East Boston under Logan’s flight paths, with the I-90/I-93 corridors close behind.
Last updated:
Find your street on the interactive map → Pan and zoom to your own block, type any US address, or use your location.
| US rank (of 297 cities, 100k+ pop) | #4 |
|---|---|
| Residents above 60 dB | 12.9% |
| Residents above 70 dB | 2.6% |
| Residents in the 45–60 dB band | 73.4% |
| Population (ACS 2016–2020) | 682,902 |
| Census tracts mapped | 202 |
Boston’s ranking is mostly an airport story. Logan sits inside the city’s harbor, which means its runways point at neighborhoods: departures and arrivals pass low over East Boston, Winthrop, Revere and Chelsea, and Massport’s own noise maps put parts of East Boston at 65+ dB with the surrounding communities at 60+. Massport has spent over $170 million soundproofing roughly 11,000 homes and three dozen schools around those flight paths — one of the largest residential sound-insulation programs in the country, and a tacit admission of what the map shows.
The rest of the red follows the highways. I-93 runs the length of the city, I-90 cuts in from the west, and unlike Sun Belt cities, Boston’s density means housing sits hard against both. The Big Dig buried the elevated Central Artery downtown in 2007, which helped the blocks around it — but this is 2020 data, all post-Big Dig, and the city still ranks fourth in the nation because you cannot bury an airport.
Boston noise: the specifics
- Massport has spent $170M+ soundproofing ~11,000 homes and 36 schools around Logan’s flight paths.
- Massport noise maps show parts of East Boston at 65+ dB and Chelsea, Revere and Winthrop at 60+ dB.
- Highest severe-exposure pocket: 2.6% of residents live above 70 dB, concentrated under the harbor approach paths.
- 12.9% of residents above 60 dB ranks #4 of 297 US cities — see the full measured ranking.
What share of Boston residents are exposed to 60 dB or louder transportation noise?
12.9% of Boston residents live with average-day transportation noise (road, rail and aviation) at or above 60 dB, and 2.6% are above 70 dB — ranking Boston #4 of 297 US cities by noise exposure.
How Boston ranks
Cities near Boston
The nearest ranked cities to Boston, each with its own share of residents above 60 dB for a like-for-like comparison.
- Cambridge, MA 7.7% ≥60 dB
- Lowell, MA 6.6% ≥60 dB
- Worcester, MA 6.1% ≥60 dB
- Providence, RI 4.6% ≥60 dB
How this map is made
This is a transparent aggregation of federal data, not an estimate: the BTS 2020 National Transportation Noise Map (road + rail + aviation) overlaid with Census ACS 2016–2020 population at tract level, clipped to the city boundary. Full methodology, limitations and the free CSV/JSON are on the US cities noise ranking. Remember what it doesn’t count: sirens, construction, nightlife and neighbors are outside the model.
License: this Boston noise map and its underlying numbers are published under CC BY 4.0 — reuse or republish the map or the figures anywhere with attribution to decibelshield.app (source: BTS 2020 National Transportation Noise Map × Census ACS; basemap © OpenStreetMap contributors, © CARTO). Download the full dataset (CSV · JSON) or the full-resolution Boston map image.
How loud is your block?
The map above shows averages by tract — your street is its own story. Measure it with the free online decibel meter → No install, nothing recorded.
Want to see the modeled road, rail and aircraft noise street by street? Open the interactive noise map zoomed to Boston → Pan and zoom to your own neighborhood, type your address to check a specific spot, or use your location.
Noise rules in Boston
Dealing with a noisy neighbor, a barking dog or after-hours construction? Boston sets quiet hours and noise limits in its municipal code. See Boston's noise ordinance — quiet hours, decibel limits and how to file a complaint → Summarized from the official code, with the exact language and a link to the source.
← All Massachusetts cities · All 297 US cities ranked · World city sound map