US cities › California › Fresno
Fresno noise map: where the city is loudest
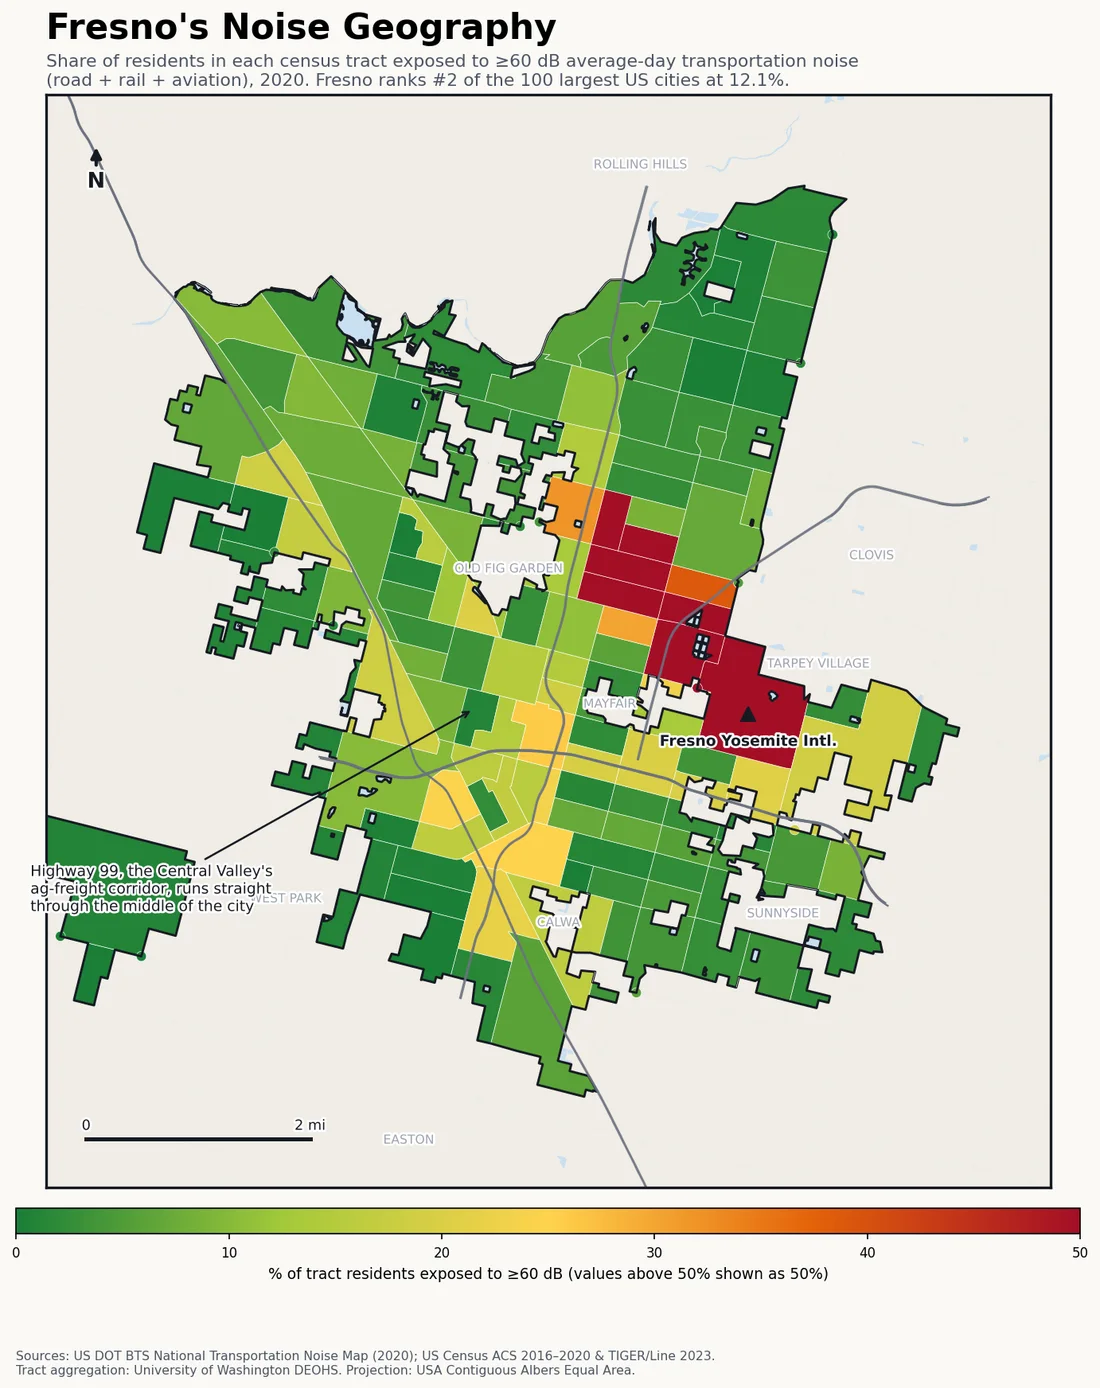
Fresno ranks fifth in the US for transportation-noise exposure: 12.1% of residents live with 60 dB or louder average-day noise. The cause runs straight through the map — Highway 99, the Central Valley’s main freight artery, bisects the city with rail running parallel.
Last updated:
Find your street on the interactive map → Pan and zoom to your own block, type any US address, or use your location.
| US rank (of 297 cities, 100k+ pop) | #5 |
|---|---|
| Residents above 60 dB | 12.1% |
| Residents above 70 dB | 2.2% |
| Residents in the 45–60 dB band | 66.6% |
| Population (ACS 2016–2020) | 488,327 |
| Census tracts mapped | 111 |
Fresno is what happens when a freight corridor and a city grow into each other. Highway 99 — the trucking spine that moves the Central Valley’s agricultural output — passes directly through the middle of town rather than around it, with Union Pacific rail running alongside. State routes 41, 168 and 180 then cross the city in the other directions, slicing it into freeway-bounded quadrants.
The urban form does the rest: Fresno is flat and spread out, and decades of growth put subdivisions and apartment blocks immediately against the freeway fences, with no terrain and little buffering. The result is a noise map where the red traces the road network with diagram-like clarity — and a severe-exposure share (2.2% of residents above 70 dB) that is effectively a census of freeway-adjacent housing.
Fresno noise: the specifics
- Highway 99, the Central Valley’s primary agricultural freight corridor, runs through the center of the city, not around it.
- Four state routes (99, 41, 168, 180) cross inside city limits, dividing Fresno into freeway-bounded quadrants.
- 2.2% of residents live above 70 dB — almost entirely in tracts touching the 99 corridor.
- 12.1% of residents above 60 dB ranks #5 of 297 US cities — see the full measured ranking.
What share of Fresno residents are exposed to 60 dB or louder transportation noise?
12.1% of Fresno residents live with average-day transportation noise (road, rail and aviation) at or above 60 dB, and 2.2% are above 70 dB — ranking Fresno #5 of 297 US cities by noise exposure.
How Fresno ranks
Cities near Fresno
The nearest ranked cities to Fresno, each with its own share of residents above 60 dB for a like-for-like comparison.
- Clovis, CA 3.9% ≥60 dB
- Visalia, CA 4% ≥60 dB
- Modesto, CA 5.7% ≥60 dB
How this map is made
This is a transparent aggregation of federal data, not an estimate: the BTS 2020 National Transportation Noise Map (road + rail + aviation) overlaid with Census ACS 2016–2020 population at tract level, clipped to the city boundary. Full methodology, limitations and the free CSV/JSON are on the US cities noise ranking. Remember what it doesn’t count: sirens, construction, nightlife and neighbors are outside the model.
License: this Fresno noise map and its underlying numbers are published under CC BY 4.0 — reuse or republish the map or the figures anywhere with attribution to decibelshield.app (source: BTS 2020 National Transportation Noise Map × Census ACS; basemap © OpenStreetMap contributors, © CARTO). Download the full dataset (CSV · JSON) or the full-resolution Fresno map image.
How loud is your block?
The map above shows averages by tract — your street is its own story. Measure it with the free online decibel meter → No install, nothing recorded.
Want to see the modeled road, rail and aircraft noise street by street? Open the interactive noise map zoomed to Fresno → Pan and zoom to your own neighborhood, type your address to check a specific spot, or use your location.
← All California cities · All 297 US cities ranked · World city sound map