US cities › Hawaii › Honolulu
Honolulu noise map: where the city is loudest
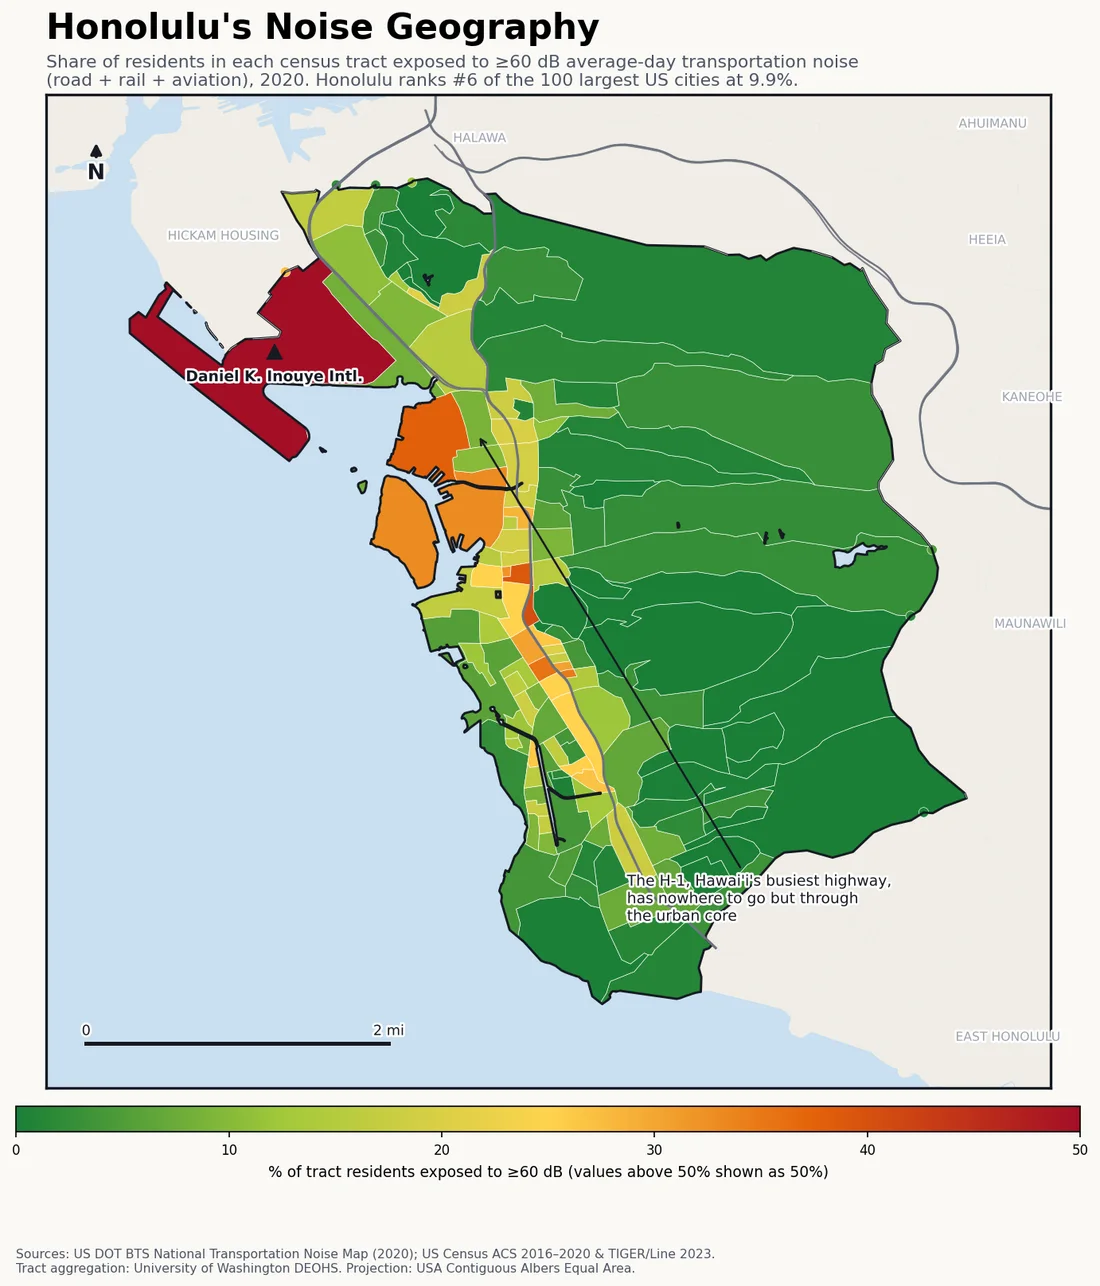
Honolulu ranks 14th in the US: 9.9% of residents live with 60 dB or louder transportation noise. Geography is destiny here — the city is a narrow strip between mountains and ocean, so the H-1 freeway and the airport corridor run through virtually everything.
Last updated:
Find your street on the interactive map → Pan and zoom to your own block, type any US address, or use your location.
| US rank (of 297 cities, 100k+ pop) | #14 |
|---|---|
| Residents above 60 dB | 9.9% |
| Residents above 70 dB | 2.1% |
| Residents in the 45–60 dB band | 30.2% |
| Population (ACS 2016–2020) | 348,116 |
| Census tracts mapped | 132 |
Honolulu is squeezed onto a coastal shelf between the Ko‘olau range and the Pacific, and that compression shows in the data. The H-1 — the busiest highway in Hawai‘i — has no choice but to run lengthwise through the urban core, stacking traffic noise onto the neighborhoods of Kalihi, downtown and Mō‘ili‘ili that have nowhere else to be.
The airport corridor compounds it on the western end, where Daniel K. Inouye International’s operations sit beside some of the city’s densest working-class housing. The result is a paradox visitors rarely notice from Waikīkī’s beach side: paradise ranks 14th in the nation for the share of residents living above 60 dB, ahead of Los Angeles.
Honolulu noise: the specifics
- The city occupies a narrow shelf between mountains and ocean, forcing the H-1 freeway through the urban core.
- The airport corridor on the western end borders some of the city’s densest residential areas (Kalihi).
- Ranks ahead of Los Angeles for share of residents above 60 dB — 9.9% vs 9.8%.
- 9.9% of residents above 60 dB ranks #14 of 297 US cities — see the full measured ranking.
What share of Honolulu residents are exposed to 60 dB or louder transportation noise?
9.9% of Honolulu residents live with average-day transportation noise (road, rail and aviation) at or above 60 dB, and 2.1% are above 70 dB — ranking Honolulu #14 of 297 US cities by noise exposure.
How Honolulu ranks
How this map is made
This is a transparent aggregation of federal data, not an estimate: the BTS 2020 National Transportation Noise Map (road + rail + aviation) overlaid with Census ACS 2016–2020 population at tract level, clipped to the city boundary. Full methodology, limitations and the free CSV/JSON are on the US cities noise ranking. Remember what it doesn’t count: sirens, construction, nightlife and neighbors are outside the model.
License: this Honolulu noise map and its underlying numbers are published under CC BY 4.0 — reuse or republish the map or the figures anywhere with attribution to decibelshield.app (source: BTS 2020 National Transportation Noise Map × Census ACS; basemap © OpenStreetMap contributors, © CARTO). Download the full dataset (CSV · JSON) or the full-resolution Honolulu map image.
How loud is your block?
The map above shows averages by tract — your street is its own story. Measure it with the free online decibel meter → No install, nothing recorded.
Want to see the modeled road, rail and aircraft noise street by street? Open the interactive noise map zoomed to Honolulu → Pan and zoom to your own neighborhood, type your address to check a specific spot, or use your location.