US cities › California › Los Angeles
Los Angeles noise map: where the city is loudest
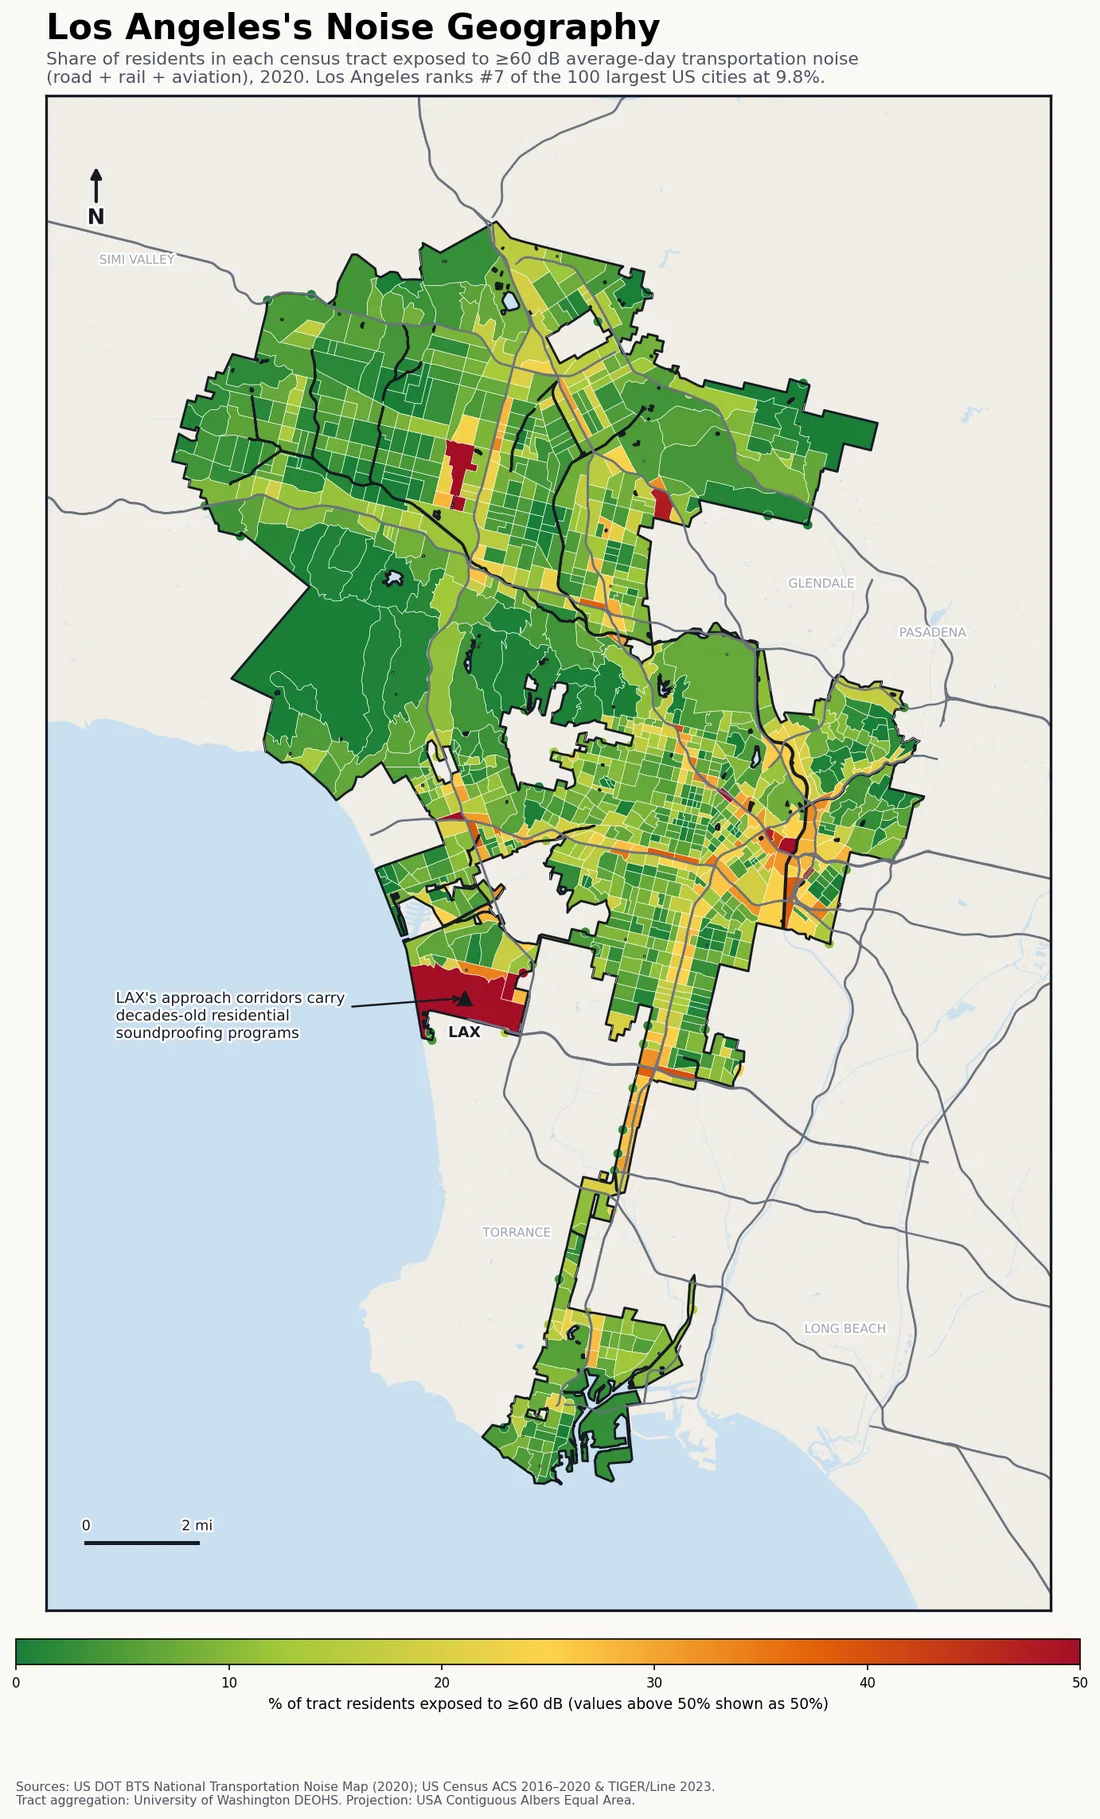
Los Angeles ranks 15th in the US, with 9.8% of its nearly four million residents — the largest absolute number of any city — living above 60 dB, and 3.7% above 70 dB. The map is a portrait of the most famous freeway network in the world, plus LAX’s approach over the southwest.
Last updated:
🔎 Los Angeles has a noise page for every one of its 110 neighborhoods. Jump to the neighborhood ranking ↓ or zoom the interactive map to your own block →
Find your street on the interactive map → Pan and zoom to your own block, type any US address, or use your location.
| US rank (of 297 cities, 100k+ pop) | #15 |
|---|---|
| Residents above 60 dB | 9.8% |
| Residents above 70 dB | 3.7% |
| Residents in the 45–60 dB band | 42.6% |
| Population (ACS 2016–2020) | 3,959,866 |
| Census tracts mapped | 1109 |
No city contributes more people to America’s noise-exposed population than Los Angeles: 9.8% of 3.96 million residents is roughly 388,000 people above 60 dB, more than the entire population of most cities on this list. The freeway grid does the bulk of it — the 405, 101, 10, 110 and 5 form a lattice across 1,109 census tracts, and the corridors glow orange end to end.
LAX adds the aviation layer across Westchester and the southwest, where decades of residential soundproofing programs have followed the flight paths. The scale cuts both ways, though: LA’s sprawl means vast tracts sit far from any freeway, which is why a city synonymous with traffic ranks 15th rather than near the top — exposure here is about who lives beside the corridor, not the corridor’s fame.
Los Angeles noise: the specifics
- Largest absolute exposed population in the US: roughly 388,000 residents above 60 dB.
- The map spans 1,109 census tracts — second only to New York’s nationwide.
- LAX’s approach corridors over Westchester carry decades-old residential soundproofing programs.
- 9.8% of residents above 60 dB ranks #15 of 297 US cities — see the full measured ranking.
What share of Los Angeles residents are exposed to 60 dB or louder transportation noise?
9.8% of Los Angeles residents live with average-day transportation noise (road, rail and aviation) at or above 60 dB, and 3.7% are above 70 dB — ranking Los Angeles #15 of 297 US cities by noise exposure.
How Los Angeles ranks
- #11 of 66 California cities in-state
- Louder: Honolulu, HI #14
- Quieter: Compton, CA #16
Cities near Los Angeles
The nearest ranked cities to Los Angeles, each with its own share of residents above 60 dB for a like-for-like comparison.
- East Los Angeles, CA 11.2% ≥60 dB
- Inglewood, CA 26.3% ≥60 dB
- Burbank, CA 11.2% ≥60 dB
- Glendale, CA 8.3% ≥60 dB
Los Angeles noise by neighborhood
The 50 loudest of Los Angeles's 110 neighborhoods, ranked by the share of residents living with 60 dB or louder transportation noise. Every neighborhood has its own page.
| # | Neighborhood | ≥60 dB | ≥70 dB |
|---|---|---|---|
| 1 | Chinatown | 36.9% | 15.7% |
| 2 | Rancho Park | 26.4% | 13.6% |
| 3 | Elysian Valley | 23.2% | 12.7% |
| 4 | Vermont Vista | 21% | 7.2% |
| 5 | Elysian Park | 20.7% | 9.1% |
| 6 | Downtown | 20% | 7.1% |
| 7 | Cypress Park | 18% | 5.5% |
| 8 | Echo Park | 17.8% | 8.2% |
| 9 | Broadway-Manchester | 17.7% | 7.2% |
| 10 | Harbor Gateway | 17.1% | 7.5% |
| 11 | Palms | 16.9% | 6.9% |
| 12 | University Park | 16.6% | 5.5% |
| 13 | Lincoln Heights | 16.3% | 8.1% |
| 14 | Mission Hills | 16.2% | 8.4% |
| 15 | Sawtelle | 15.1% | 7% |
| 16 | Boyle Heights | 15% | 6.6% |
| 17 | East Hollywood | 15% | 6.9% |
| 18 | North Hills | 14.4% | 5.3% |
| 19 | Harbor City | 14.4% | 6.8% |
| 20 | West Los Angeles | 14.3% | 4.5% |
| 21 | Lake Balboa | 14.1% | 1.2% |
| 22 | Hollywood | 13.7% | 6.6% |
| 23 | Adams-Normandie | 13.7% | 5.3% |
| 24 | Westchester | 13.6% | 4.2% |
| 25 | Sun Valley | 13.4% | 4.9% |
| 26 | Mid-City | 13.3% | 5.9% |
| 27 | Glassell Park | 12.9% | 4.7% |
| 28 | Playa Vista | 12.8% | 6.9% |
| 29 | Vermont Knolls | 12.6% | 3.3% |
| 30 | Atwater Village | 12.6% | 3.4% |
| 31 | Sherman Oaks | 12.4% | 5% |
| 32 | Gramercy Park | 12.3% | 2.2% |
| 33 | Vermont-Slauson | 12% | 3.2% |
| 34 | Playa del Rey | 11.9% | 2.3% |
| 35 | Pacoima | 11.6% | 4.5% |
| 36 | Valley Village | 11.6% | 4.2% |
| 37 | West Adams | 11.5% | 5.1% |
| 38 | Toluca Lake | 11.5% | 4.8% |
| 39 | Studio City | 11.4% | 4% |
| 40 | Lake View Terrace | 11.2% | 5.1% |
| 41 | Wilmington | 11.1% | 5% |
| 42 | Pico-Union | 11% | 5.5% |
| 43 | Arlington Heights | 10.9% | 6.5% |
| 44 | Harvard Heights | 10.5% | 6.3% |
| 45 | Exposition Park | 10% | 3.2% |
| 46 | Century City | 10% | 3.3% |
| 47 | Highland Park | 9.9% | 3.4% |
| 48 | Hollywood Hills | 9.8% | 4.7% |
| 49 | Beverly Grove | 9.8% | 2.2% |
| 50 | Leimert Park | 9.8% | 3.3% |
That's the 50 loudest. Find any of Los Angeles's 110 neighborhoods on the interactive noise map, or open one above and use its neighbor links to walk the full ranking.
How this map is made
This is a transparent aggregation of federal data, not an estimate: the BTS 2020 National Transportation Noise Map (road + rail + aviation) overlaid with Census ACS 2016–2020 population at tract level, clipped to the city boundary. Full methodology, limitations and the free CSV/JSON are on the US cities noise ranking. Remember what it doesn’t count: sirens, construction, nightlife and neighbors are outside the model.
License: this Los Angeles noise map and its underlying numbers are published under CC BY 4.0 — reuse or republish the map or the figures anywhere with attribution to decibelshield.app (source: BTS 2020 National Transportation Noise Map × Census ACS; basemap © OpenStreetMap contributors, © CARTO). Download the full dataset (CSV · JSON) or the full-resolution Los Angeles map image.
How loud is your block?
The map above shows averages by tract — your street is its own story. Measure it with the free online decibel meter → No install, nothing recorded.
Want to see the modeled road, rail and aircraft noise street by street? Open the interactive noise map zoomed to Los Angeles → Pan and zoom to your own neighborhood, type your address to check a specific spot, or use your location.
← All California cities · All 297 US cities ranked · World city sound map