US cities › California › San Francisco
San Francisco noise map: where the city is loudest
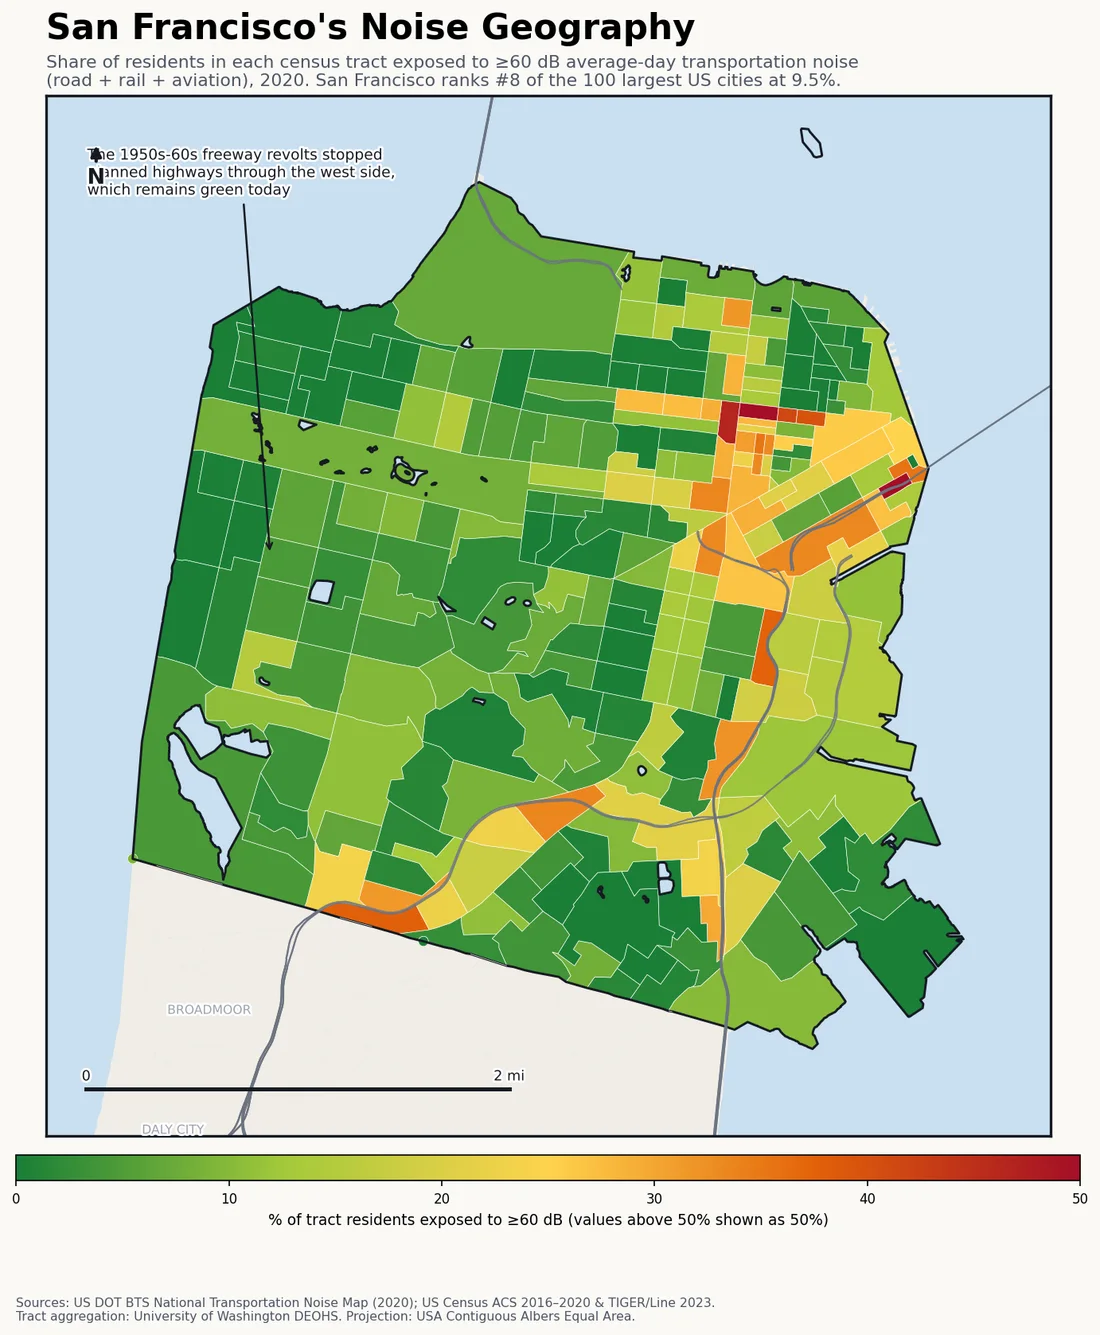
San Francisco ranks 18th in the US: 9.5% of residents live above 60 dB. With no airport inside city limits, this is a pure road-and-rail map — US-101 and I-280 burn through the southeast quadrant while the famously freeway-free west side stays green.
Last updated:
Find your street on the interactive map → Pan and zoom to your own block, type any US address, or use your location.
| US rank (of 297 cities, 100k+ pop) | #18 |
|---|---|
| Residents above 60 dB | 9.5% |
| Residents above 70 dB | 2.7% |
| Residents in the 45–60 dB band | 34.9% |
| Population (ACS 2016–2020) | 874,784 |
| Census tracts mapped | 242 |
San Francisco is a natural control case: SFO sits ten miles south in San Mateo County, so the city’s exposure is almost entirely roads. US-101 enters along the eastern bayshore and I-280 up the southern spine, and the neighborhoods between them — the Mission, SoMa, Bayview-Hunters Point — absorb most of the city’s red.
The west side tells the other half of the story. The freeway revolts of the 1950s and 60s famously stopped planned highways through Golden Gate Park and the Sunset, and the noise map is the receipt: the entire western half of the city sits in green, a half-century-old planning decision still visible as quiet. Few maps argue as clearly that freeway routing is a choice.
San Francisco noise: the specifics
- No airport inside city limits — SFO is in San Mateo County — making this a nearly pure road-noise map.
- The 1950s–60s freeway revolts stopped planned highways through the west side, which remains green on the map today.
- Exposure concentrates in the southeast quadrant along US-101 and I-280 (Mission, SoMa, Bayview).
- 9.5% of residents above 60 dB ranks #18 of 297 US cities — see the full measured ranking.
What share of San Francisco residents are exposed to 60 dB or louder transportation noise?
9.5% of San Francisco residents live with average-day transportation noise (road, rail and aviation) at or above 60 dB, and 2.7% are above 70 dB — ranking San Francisco #18 of 297 US cities by noise exposure.
How San Francisco ranks
- #13 of 66 California cities in-state
- Louder: North Charleston, SC #17
- Quieter: Tempe, AZ #19
Cities near San Francisco
The nearest ranked cities to San Francisco, each with its own share of residents above 60 dB for a like-for-like comparison.
- Berkeley, CA 6.8% ≥60 dB
- Oakland, CA 10% ≥60 dB
- Richmond, CA 11.1% ≥60 dB
- Hayward, CA 9% ≥60 dB
How this map is made
This is a transparent aggregation of federal data, not an estimate: the BTS 2020 National Transportation Noise Map (road + rail + aviation) overlaid with Census ACS 2016–2020 population at tract level, clipped to the city boundary. Full methodology, limitations and the free CSV/JSON are on the US cities noise ranking. Remember what it doesn’t count: sirens, construction, nightlife and neighbors are outside the model.
License: this San Francisco noise map and its underlying numbers are published under CC BY 4.0 — reuse or republish the map or the figures anywhere with attribution to decibelshield.app (source: BTS 2020 National Transportation Noise Map × Census ACS; basemap © OpenStreetMap contributors, © CARTO). Download the full dataset (CSV · JSON) or the full-resolution San Francisco map image.
How loud is your block?
The map above shows averages by tract — your street is its own story. Measure it with the free online decibel meter → No install, nothing recorded.
Want to see the modeled road, rail and aircraft noise street by street? Open the interactive noise map zoomed to San Francisco → Pan and zoom to your own neighborhood, type your address to check a specific spot, or use your location.
← All California cities · All 297 US cities ranked · World city sound map