US cities › California › Stockton
Stockton noise map: where the city is loudest
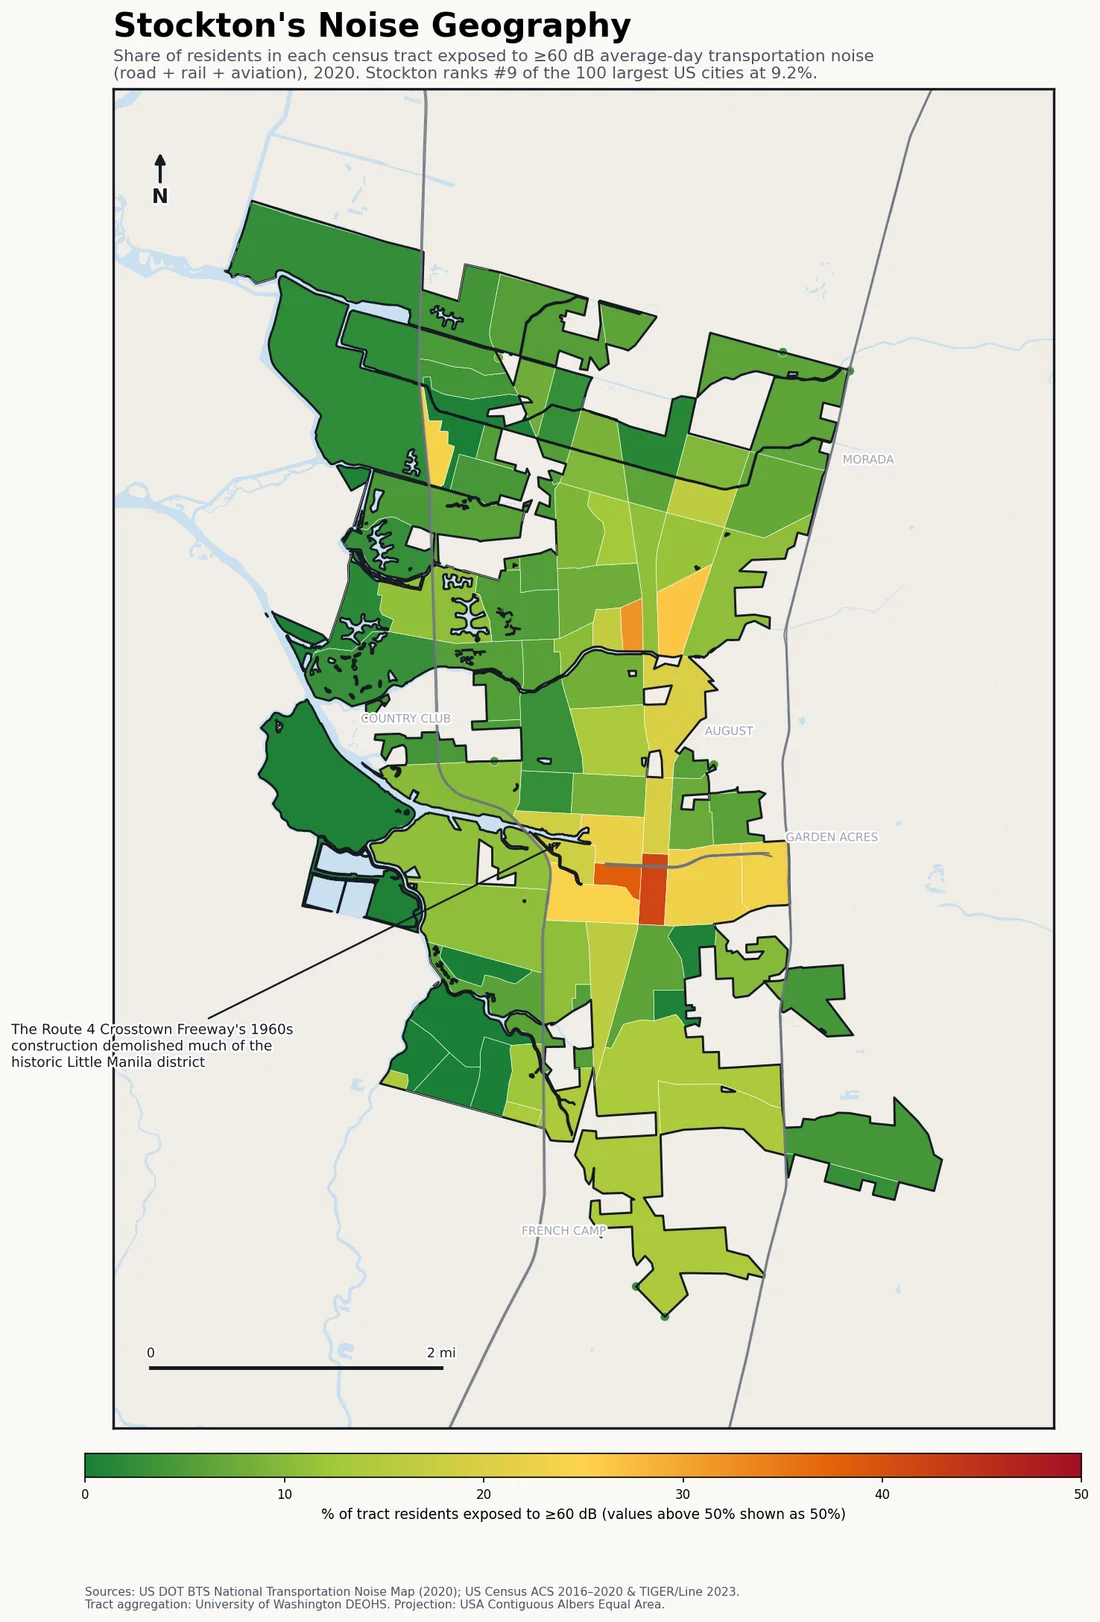
Stockton ranks 20th in the US: 9.2% of residents live above 60 dB. Freight surrounds the city on every side — I-5 through downtown, the Route 4 Crosstown Freeway across its middle, Highway 99 on the east edge, a deep-water port and major rail yards.
Last updated:
Find your street on the interactive map → Pan and zoom to your own block, type any US address, or use your location.
| US rank (of 297 cities, 100k+ pop) | #20 |
|---|---|
| Residents above 60 dB | 9.2% |
| Residents above 70 dB | 2.3% |
| Residents in the 45–60 dB band | 49.8% |
| Population (ACS 2016–2020) | 289,925 |
| Census tracts mapped | 68 |
Stockton is a freight city in every direction. I-5 runs through downtown and the Route 4 Crosstown Freeway cuts straight across the city’s middle — a 1960s alignment that demolished much of the historic Little Manila district, one of the era’s textbook freeway-through-the-neighborhood decisions. Highway 99 closes the loop along the eastern edge.
Then comes the freight that isn’t on rubber wheels: Stockton operates an inland deep-water port reached by ship channel from the Bay, and BNSF runs a major intermodal facility on the city’s edge with Union Pacific’s yard just south. Between the highways, the port and the rail corridors, the tract map shows orange threading through a city that handles a remarkable share of Northern California’s goods movement for its size.
Stockton noise: the specifics
- The Route 4 Crosstown Freeway’s 1960s construction demolished much of the historic Little Manila neighborhood.
- Stockton operates an inland deep-water seaport, reached by ship channel from San Francisco Bay.
- BNSF runs a major intermodal rail facility at the city’s edge, with Union Pacific’s yard just south in Lathrop.
- 9.2% of residents above 60 dB ranks #20 of 297 US cities — see the full measured ranking.
What share of Stockton residents are exposed to 60 dB or louder transportation noise?
9.2% of Stockton residents live with average-day transportation noise (road, rail and aviation) at or above 60 dB, and 2.3% are above 70 dB — ranking Stockton #20 of 297 US cities by noise exposure.
How Stockton ranks
- #14 of 66 California cities in-state
- Louder: Tempe, AZ #19
- Quieter: Ontario, CA #21
Cities near Stockton
The nearest ranked cities to Stockton, each with its own share of residents above 60 dB for a like-for-like comparison.
- Modesto, CA 5.7% ≥60 dB
- Elk Grove, CA 5.1% ≥60 dB
- Concord, CA 7.4% ≥60 dB
- Sacramento, CA 8.9% ≥60 dB
How this map is made
This is a transparent aggregation of federal data, not an estimate: the BTS 2020 National Transportation Noise Map (road + rail + aviation) overlaid with Census ACS 2016–2020 population at tract level, clipped to the city boundary. Full methodology, limitations and the free CSV/JSON are on the US cities noise ranking. Remember what it doesn’t count: sirens, construction, nightlife and neighbors are outside the model.
License: this Stockton noise map and its underlying numbers are published under CC BY 4.0 — reuse or republish the map or the figures anywhere with attribution to decibelshield.app (source: BTS 2020 National Transportation Noise Map × Census ACS; basemap © OpenStreetMap contributors, © CARTO). Download the full dataset (CSV · JSON) or the full-resolution Stockton map image.
How loud is your block?
The map above shows averages by tract — your street is its own story. Measure it with the free online decibel meter → No install, nothing recorded.
Want to see the modeled road, rail and aircraft noise street by street? Open the interactive noise map zoomed to Stockton → Pan and zoom to your own neighborhood, type your address to check a specific spot, or use your location.
← All California cities · All 297 US cities ranked · World city sound map