 Decibel Shield
US cities › Florida › Port St. Lucie
Port St. Lucie noise map: where the city is loudest
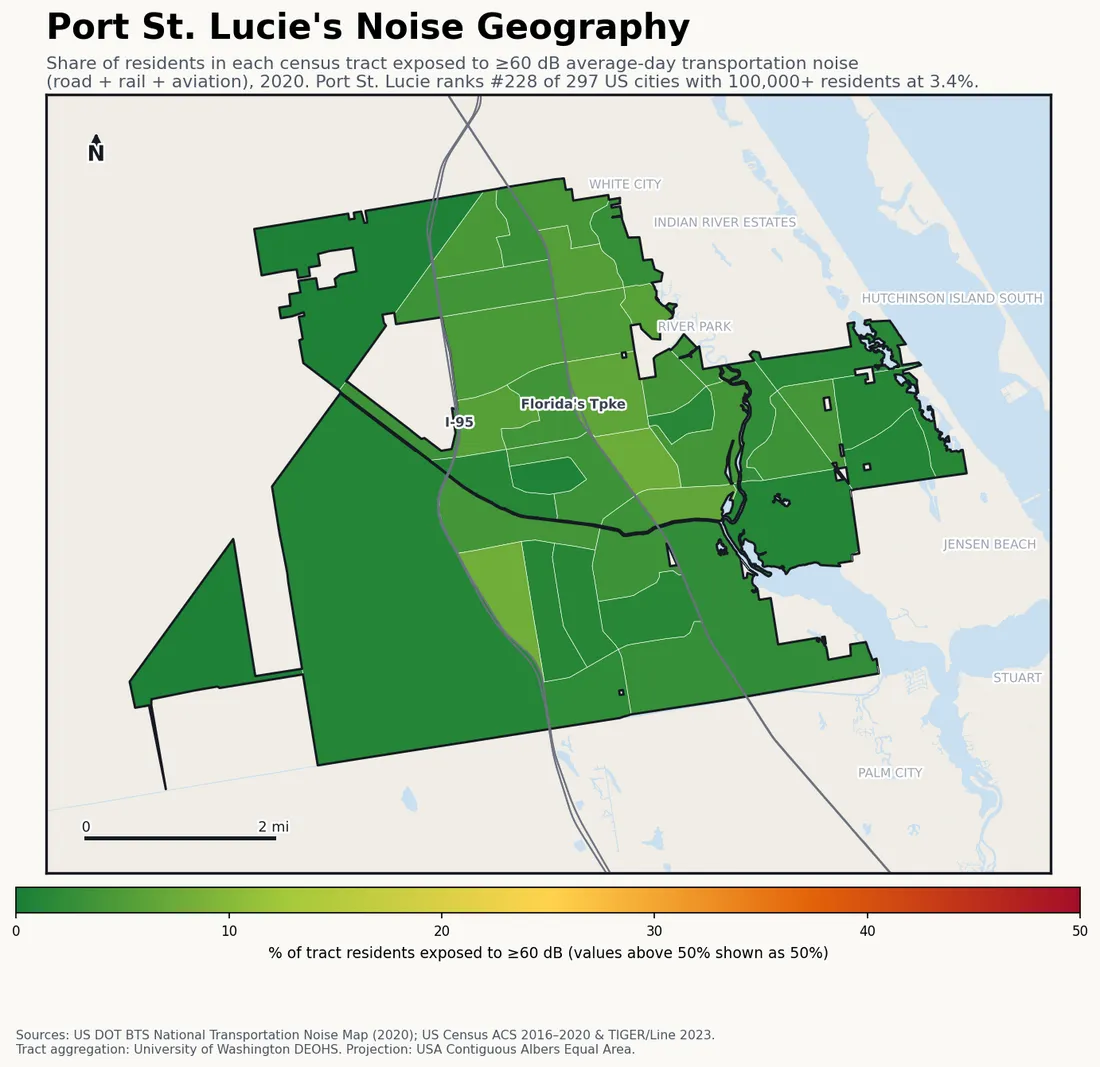
In Port St. Lucie, Florida, 3.4% of residents live with average-day transportation noise of 60 dB or louder — road, rail and aviation combined. That ranks Port St. Lucie #228 of 297 US cities of 100,000+ people, below the national median — quieter than most big US cities. The map below colors all 34 census tracts by exposure, from the quietest blocks to the loudest.
Last updated:
Find your street on the interactive map → Pan and zoom to your own block, type any US address, or use your location.
| US rank (of 297 cities, 100k+ pop) | #228 |
|---|---|
| Residents above 60 dB | 3.4% |
| Residents above 70 dB | 1% |
| Residents in the 45–60 dB band | 10.1% |
| Population (ACS 2016–2020) | 187,990 |
| Census tracts mapped | 34 |
Port St. Lucie's 34 census tracts span the full range of the federal noise map. Of its 187,990 residents, 3.4% are exposed to 60 dB or more of average-day road, rail and aviation noise. Within that, 1% face the most severe band — 70 dB or louder, the level at which sustained exposure starts damaging hearing. A further 10.1% sit in the 45–60 dB band — a noticeable background hum rather than a hearing risk. Overall the city ranks #228 of 297, below the national median — quieter than most big US cities.
Among Florida's 25 cities of 100,000+ residents, Port St. Lucie is the 18th-loudest. Nationally it sits just below Aurora, CO (#227) and just above Chula Vista, CA (#229).
On the map, green tracts are the quietest and red tracts the loudest, with each colored by the share of its own residents above 60 dB — so you can see exactly which parts of Port St. Lucie carry the noise. The loudest tracts track the city's busiest road, rail and flight corridors. These are modeled values from the US DOT's 2020 National Transportation Noise Map paired with Census population, aggregated to tracts by the University of Washington — real data per tract, no interpolation and no estimate.
Port St. Lucie noise: the specifics
- Ranks #228 of 297 US cities (100k+ pop) by share of residents exposed to ≥60 dB transportation noise.
- 3.4% of Port St. Lucie's 187,990 residents live with 60 dB or louder average-day transportation noise.
- 1% are in the severe 70 dB+ band; 10.1% sit in the 45–60 dB moderate range.
- Computed across 34 census tracts from the federal BTS 2020 noise map × ACS 2016–2020 population.
- 3.4% of residents above 60 dB ranks #228 of 297 US cities — see the full federal ranking.
What share of Port St. Lucie residents are exposed to 60 dB or louder transportation noise?
3.4% of Port St. Lucie residents live with average-day transportation noise (road, rail and aviation) at or above 60 dB, and 1% are above 70 dB — ranking Port St. Lucie #228 of 297 US cities by noise exposure.
How Port St. Lucie ranks
- #18 of 25 Florida cities in-state
- Louder: Aurora, CO #227
- Quieter: Chula Vista, CA #229
Cities near Port St. Lucie
The nearest ranked cities to Port St. Lucie, each with its own share of residents above 60 dB for a like-for-like comparison.
- West Palm Beach, FL 7.6% ≥60 dB
- Palm Bay, FL 1.8% ≥60 dB
- Coral Springs, FL 3.5% ≥60 dB
- Pompano Beach, FL 7.6% ≥60 dB
How this map is made
This is a transparent aggregation of federal data, not an estimate: the BTS 2020 National Transportation Noise Map (road + rail + aviation) overlaid with Census ACS 2016–2020 population at tract level, clipped to the city boundary. Full methodology, limitations and the free CSV/JSON are on the US cities noise ranking. Remember what it doesn’t count: sirens, construction, nightlife and neighbors are outside the model.
License: this Port St. Lucie noise map and its underlying numbers are published under CC BY 4.0 — reuse or republish the map or the figures anywhere with attribution to decibelshield.app (source: BTS 2020 National Transportation Noise Map × Census ACS; basemap © OpenStreetMap contributors, © CARTO). Download the full dataset (CSV · JSON) or the full-resolution Port St. Lucie map image.
How loud is your block?
The map above shows averages by tract — your street is its own story. Measure it with the free online decibel meter → No install, nothing recorded.
Want to see the modeled road, rail and aircraft noise street by street? Open the interactive noise map zoomed to Port St. Lucie → Pan and zoom to your own neighborhood, type your address to check a specific spot, or use your location.
← All Florida cities · All 297 US cities ranked · World city sound map