 Decibel Shield
UK cities › England › Reading
How loud is Reading?
Ranked by the average noise level among the residents who are exposed, Reading is #51 of 65 English urban areas in the government's strategic noise mapping, placing it among the quietest quarter of that list. In Reading, most noise-exposed residents face average day-evening-night (Lden) transport noise of 55–70 dB, mostly from road traffic, dropping to 50–65 dB at night.
Last updated:
| England rank (of 65) | #51 |
|---|---|
| Daytime Lden range | 55–70 dB |
| Night Lnight range | 50–65 dB |
| vs. WHO guideline | ≈ 10 dB above the 53 dB Lden road-noise guideline (night guideline: 45 dB) |
| Dominant source | road traffic |
| Mapped area | Reading/Wokingham (England) |
| Population | 393,000 |
| Data round | Round 3 (2017) |
Like every UK urban area over 100,000 people, Reading is required to be noise-mapped under the environmental noise regulations, and this page shows the official published result. The figures cover the official "Reading/Wokingham" agglomeration, the statutory noise-mapping area, which is wider than the city centre alone.
Across the 393,000 residents of the mapped area, the bulk of those exposed to transport noise sit in the 55–70 dB Lden band by day-evening-night average and 50–65 dB Lnight at night, with road traffic the dominant source. The midpoint of that daytime range is roughly 10 dB above the WHO's 53 dB Lden road-noise guideline (the night guideline is 45 dB Lnight).
These statistics come from the Round 3 strategic noise mapping (2017, the latest England exposure statistics published). Defra publishes these exposure statistics as counts of people per dB band rather than one number per place, and most English urban areas share the same broad daytime band. The ranking therefore comes from the population-weighted average level across those bands among the exposed residents, which separates areas that the band alone cannot. Defra's Round 4 maps (2022) exist as noise-level grids, but the matching population-exposure tables are due to be published with the next Noise Action Plans — this page will be updated to Round 4 when they land.
Environmental noise in Reading, by the numbers
- England rank: #51 of 65 mapped urban areas (loudest = #1)
- Daytime (Lden) exposure band: 55–70 dB for the bulk of exposed residents
- Night (Lnight) exposure band: 50–65 dB
- Dominant noise source: road traffic
- Mapped-area population: 393,000
- Data: Round 3 (2017), England strategic noise mapping
These are the official published exposure statistics from the UK's strategic noise mapping — see the methodology on the UK city ranking. Lden is the annual-average day-evening-night level; only residents above the 55 dB Lden threshold are reported.
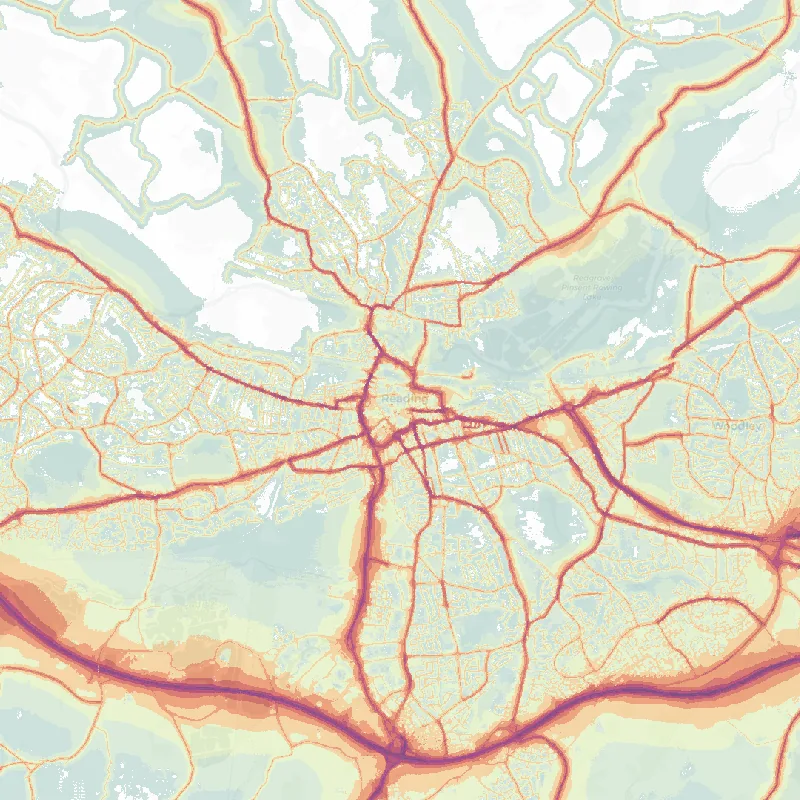
License: Reading's derived figures and noise map are published under CC BY 4.0 — reuse or republish with attribution to decibelshield.app. Contains public sector information from Defra, the Scottish Government, the Welsh Government and DAERA, licensed under the Open Government Licence v3.0. Basemap © OpenStreetMap contributors, © CARTO. Download the full dataset (CSV · JSON) or the Reading map image.
How Reading ranks
- #51 of 65 ranked England cities in-nation
- Louder: Luton #50
- Quieter: Southampton #52
Cities near Reading
The nearest mapped cities to Reading, each with its own daytime range from the same strategic noise mapping for a like-for-like comparison.
- High Wycombe 55–75 dB · 25 km
- Slough 55–70 dB · 27 km
- Aldershot 55–70 dB · 27 km
- Oxford 55–75 dB · 38 km
Measure your own street
Standing somewhere loud in Reading right now? Measure it with the free online decibel meter → No install, nothing recorded.