 Decibel Shield
US cities › New York › South Ozone Park
South Ozone Park noise map: how loud is it?
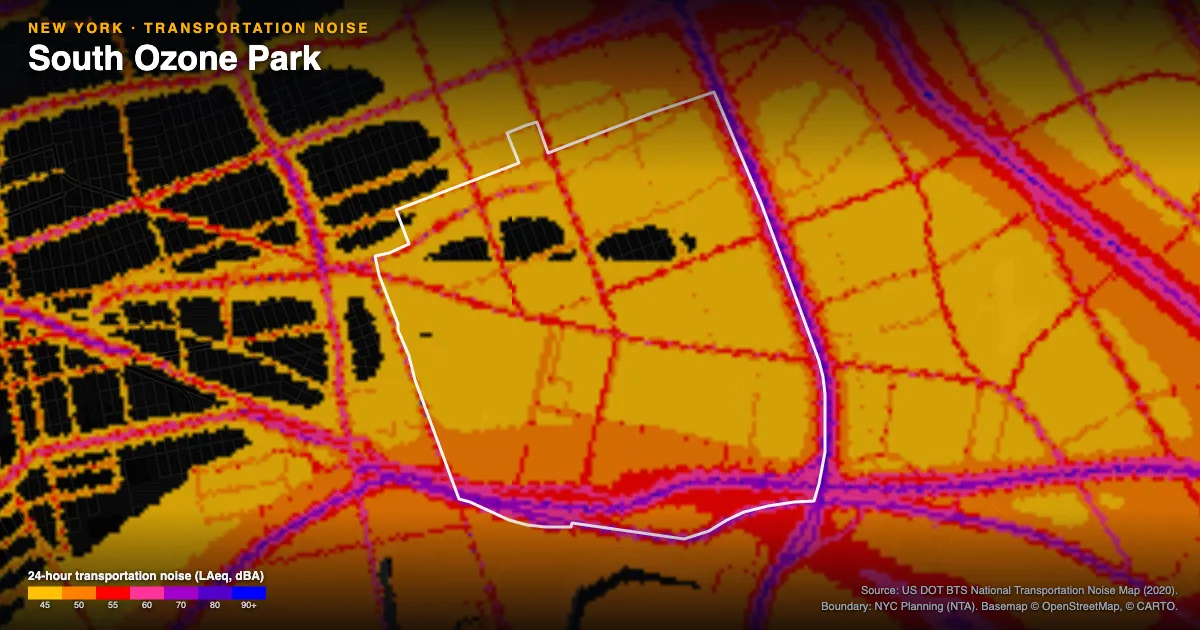
South Ozone Park is one of New York's quieter neighborhoods: just 3.5% of residents face 60 dB or louder average-day transportation noise (road, rail and aviation), ranking it 139th of 197 New York neighborhoods. Most streets sit well back from any freeway, rail line or flight path; the map shows where the noise does reach.
Last updated:
| Rank in New York (of 197 neighborhoods) | #139 |
|---|---|
| Residents above 60 dB | 3.5% |
| Residents above 70 dB | 0.8% |
| Residents in the 45–60 dB band | 90.5% |
| Residents (ACS 2016–2020, area-weighted) | 80,870 |
| Census tracts mapped | 45 |
South Ozone Park is home to about 80,870 residents across 45 census tracts. 3.5% of them are exposed to 60 dB or more of average-day road, rail and aviation noise. Within that, 0.8% face the most severe band — 70 dB or louder, the level at which sustained exposure starts to threaten hearing. A further 90.5% sit in the 45–60 dB band — a noticeable background hum rather than a hearing risk. That ranks South Ozone Park #139 of 197 New York neighborhoods, quieter than most New York neighborhoods. Among New York neighborhoods it sits just below Brighton Beach (#138) and just above Cypress Hills (#140).
South Ozone Park mostly sits away from the loud corridors. Where the noise does climb it traces a single freeway, rail line or flight path near the edge of the neighborhood rather than the residential core, so the great majority of blocks stay calm. The map pinpoints exactly where the exposure is.
South Ozone Park noise: the specifics
- Ranks #139 of 197 New York neighborhoods by share of residents exposed to ≥60 dB transportation noise.
- 3.5% of South Ozone Park's ~80,870 residents live with 60 dB or louder average-day transportation noise.
- 0.8% are in the severe 70 dB+ band; 90.5% sit in the 45–60 dB moderate range.
- Area-weighted across 45 census tracts from the federal BTS 2020 noise map × ACS 2016–2020 population.
- #139 of 197 — see the full New York ranking.
What share of South Ozone Park residents are exposed to 60 dB or louder transportation noise?
3.5% of South Ozone Park residents live with average-day transportation noise (road, rail and aviation) at or above 60 dB, and 0.8% are above 70 dB — ranking South Ozone Park #139 of 197 New York neighborhoods by noise exposure.
How South Ozone Park compares
How this is calculated
This is a transparent aggregation of federal data, not an estimate: the US DOT 2020 National Transportation Noise Map (road + rail + aviation), paired with Census population by the University of Washington and area-weighted to the New York Times boundary for South Ozone Park. It does not count sirens, construction, nightlife or neighbors, and it resolves busy corridors better than quiet local streets. BTS itself describes the map as simplified noise modeling that should not be used to evaluate noise levels at individual locations or specific times, so read these as neighborhood-scale averages, not readings at any one address. For your exact spot, measure it with the free online decibel meter →
← All New York neighborhoods · Interactive US noise map · All US cities